In the News - 12. Groundhog Day
Groundhog Day
It’s been a harsh few months of winter in the crypto market, with token prices falling hard and once-stable companies and organizations reducing workforces or even vanishing overnight. With Coinbase announcing another layoff of nearly 20% of employees, some might be feeling like Bill Murray in Groundhog Day, forced to relive events over and over again.
With that in mind, let’s turn to our friend the groundhog for an early crypto-winter prediction: are we nearly through to spring, or will winter’s cold snap continue on even longer? Back your assertion by creating a dashboard with on-chain data that supports your arguments in favor of either a continued downturn in the space or a soon-to-come rally.
Introduction
Groundhog Day is a traditional holiday that takes place on February 2nd each year in the United States and Canada. According to legend, if a groundhog emerges from its burrow on this day and sees its shadow, there will be six more weeks of winter weather. If the groundhog does not see its shadow, it is said to indicate that spring will arrive early. However, The accuracy of the groundhog predictions have a poor accuracy rate. In reality, the predictions of the groundhog are based on a folk tradition and have no scientific basis.
Method
In the current dashboard I used fact_token_prices_hourly tables on Flipsidecrypto’s database to find the average price of assessed tokens.
Then by use of core.fact_swaps tables calculated the swap volume for each token.
Also, tacked the ETH and some major tokens transferring state by ethereum.core.ez_eth_transfers table over past 3 months.
The period time was selected over past 3 months.
The assessed tokens to comparable with ETH are ATOM, MATIC, SOL, OP, BNB and BTC to track their price changes over selected period time.
This dashboard has been set up with SOL by default as a comparable token, but you can change it to other offered tokens after log in to Flipside, by above tape.
✍🏻 Conclusion
As of Findings above:
While the crypto market may still be in a state of volatility, some blockchain platforms such as Solana appear to be experiencing growth in volatility, indicating that although most of them are affected by some events like FTX’s demise or Coinbase’s layoffs, they could recover the majority of their losses over the course of only one month, which suggests that the crypto winter may not be too severe for the crypto market.
Furthermore, the cryptocurrency market, like other financial markets, is dependent on the global macroeconomy, and when the overall market goes into a bear or bull market, these assets will follow suit.
Hey there 👋!
Firstly, I appreciate you sticking with it until the conclusion.
I'm Hamed, a civil engineering Ph.D.
student interested in data analysis.
I've made many similar dashboards and visualizations since I started at Flipside in January.
Please take a look at my various contact details and let me know what you think.
About:
-
Author: HaM☰d
\
-
Discord: 0xHaM☰d#8391
\
-
Twitter: @arjmandi_hamed
\
-
Email: h_arjmandi2012@yahoo.com
🔎 Findings:
- Since October 17th, the value of Ethereum and top-market tokens has increased, with the exception of Sol, which has decreased by -22.4%.
- In the past 3 months, the tokens in the graph on the right indicate the return percent was in the range of -22.4% to 140% in the past 3 months.
- The events of FTX seem to be the catalyst for the drop in the price of the SOL token.
Ethereum and OP prices increased by 17.2 and 140%, respectively.
The crypto market had a rough winter last year, with most tokens falling to less than one-third of their all-time high.
The following graphs show the various moving averages (MA) that are calculated by dividing the present day by the past 100 days, for MA 100-day, for example.
As can be seen, the ETH and selected token (SOL by default) went to the MA100 and MA200 levels.
Whilst, we know when the price reach to MA100 & 200 and passed them, tend to go away from these MAs, so can expected if the price goes to be stable above these MAs then went up further more.
🔎 Findings:
-
The charts on the right and left show the daily newcomer wallets to the Ethereum and Solana (as selected chains) ecosystems over the past 90 days.
As can be seen, a large number of wallet addresses executed their first transactions on Ethereum on December 9th, and on Solana, the trend of adding new wallets to the ecosystem has increased since second half of December.
🔎 Findings:
The graphs on the right show the swap volume in terms of bought, sold, and net swapped volumes of ETH and selected tokens (SOL by default). As can be seen, although the FTX's bankruptcy on November 7th had a significant impact on the price of ETH, so that the sold volume in November 8, 9, and 10 reached a new all-time high, and peaked at more than 20 million ETH on November 10th compared to only 1.5 million ETH bought. On the other hand, there is similar trend on SOL these days, but, in Solana Swapping, has begun a volatile days in swap volume and transactions count since late December.
🔎 Findings:
The line charts right show the growth of sold, bought, and net volumes of ETH and SOL.
Although the ETH couldn’t recover the sold out tokens affected by FTX’s demise, yet. as can be seen the cumulative swapped volume from ETH to other tokens are dramatically higher than swapping to ETH, but in the other hand the SOL swapping approximately recovered the effects of FTX’s demise.
:hourglass_flowing_sand: Transferring State
🔎 Findings:
The visuals in this part present an overview of transferring transactions on Ethereum.
As can be observed, the transferred average volume peaked at 14.4 ETH and 210 SOL on Nov 9th, and the Maximum transferred amount took place on this day.
Over 216.2 million ETH and 8.8B SOL has been transferred in the past 3 months, a large portion of which has been impacted by FTX's demise.
So, let's see where those has gone.
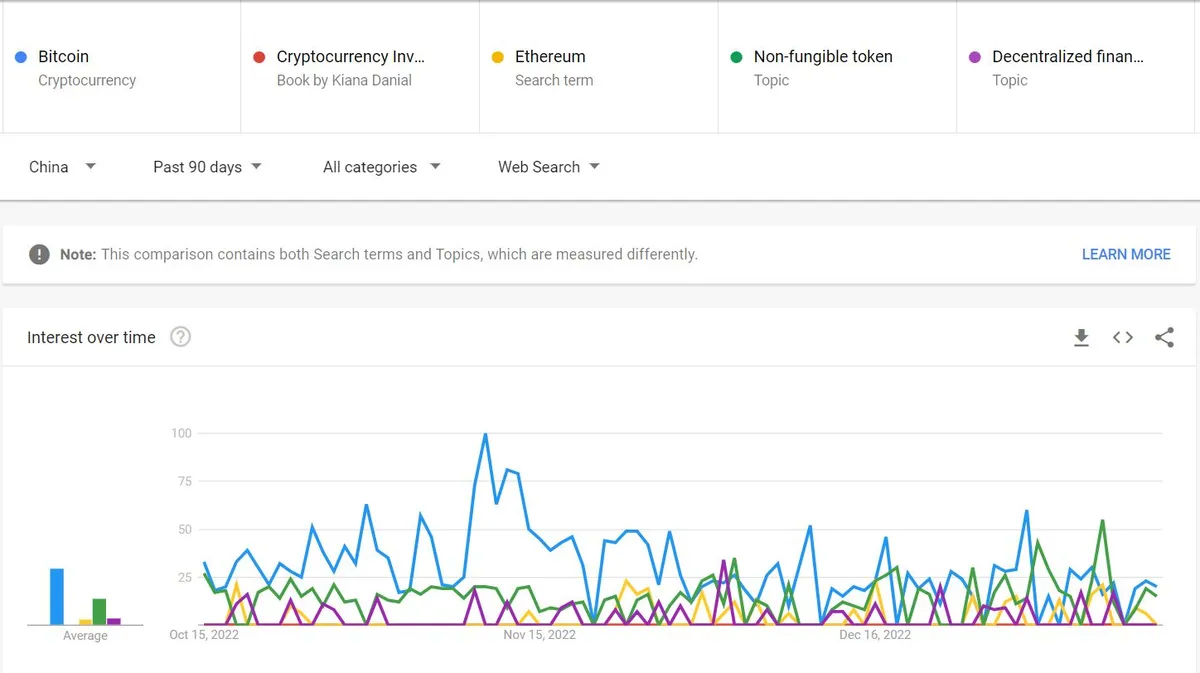
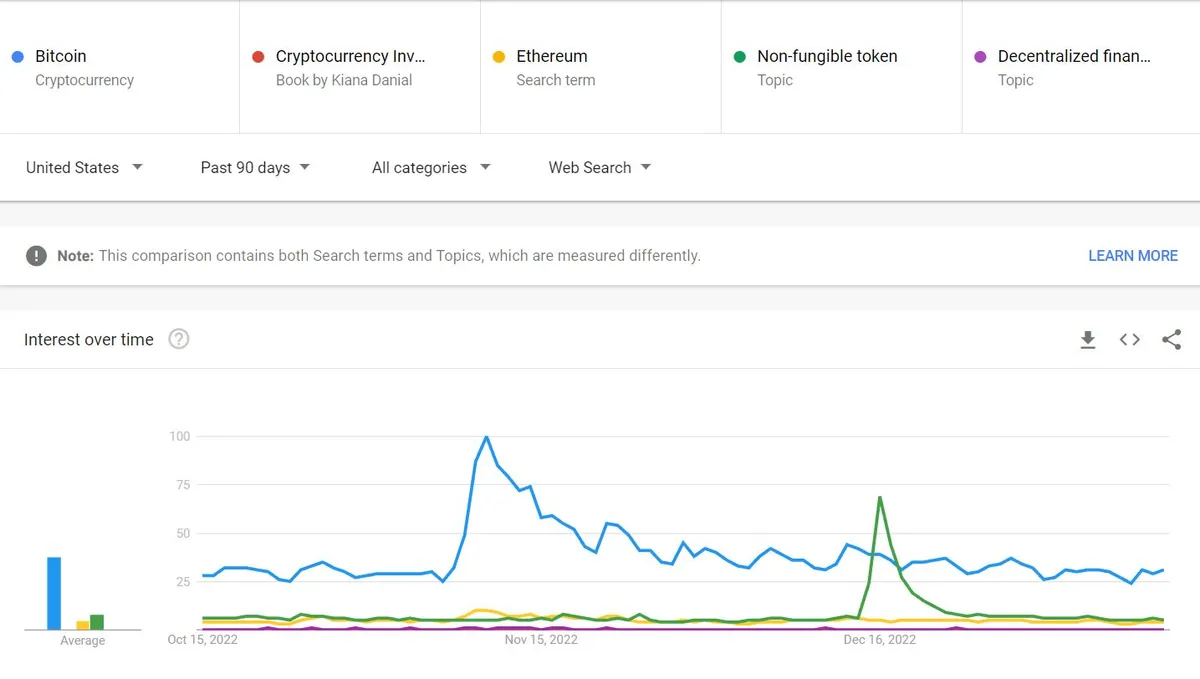
:mag_right: Google Trend:
In the following Image I tried to track the Google trend in China and USA as two major crypto communities. as can be seen since last Dec, the most of days the Bitcoin as the king of cryptocurrencies are in trend and in second place the NFTs as one of the major features of crypto has been in trend. Also, an increase in the number of people searching for cryptocurrency investment or the crypto market as a whole can indicate renewed interest in the space.

🔎 Findings:
Attempts have been made in this section to track the transferred ETH and Selected token (SOL by default).
The most percent of transfer transactions destination are unknown (47 & 95% in ETH & SOL, respectively).
33% of that transferred to CEXs(Centralized Exchanges) in ETH, and 8.7% of that transferred to dapps.
Meanwhile, in terms of volume, the other thing are observable.
Although, 47% of transferring destinations are unknown, but the huge amount of that transferred to cexs (33%).
Also in SOL, in most days, the average transferred volume took place to transferring tokens to cexs, too. and in Dec 21 and 22th, its peaked at over 1K and about 2K, respectively.
Also, as can be seen the transferrers count increased since second half of last December.