NEAR Performance
Introduction
The NEAR Protocol is an innovative platform for smart contracts that provides both scalability and usability. Through the use of sharding, it will scale in a manner that is linearly proportional to the number of validation nodes on the network. With the help of WebAssembly (through Rust and AssemblyScript), improved contract administration, ephemeral accounts, and a plethora of other innovations, NEAR has made it finally possible for users and developers alike to find it simple to use a blockchain system.
Transaction Speed
Transaction speed and performance is the rate at which data is transferred from one account to another. The faster a transaction is confirmed, the better the transaction speed is said to be. Transaction speed and performance of a blockchain is one of the prime parameters through which viability of a blockchain is gauged.
Transaction speed in turn hinges upon numerous other factors like block size, block time, traffic on the network, transaction fees, etc.
The common indicator for determining the speed of transactions in a blockchain is the number of transactions performed (Succeeded and Failed) per minute. This research is based on the definition.
Method
In this Study
One of Near's main features is its speed compared to other blockchains.
In this study, what we are looking for are:
- How many transactions are performed per minute in the Near network?
- How many of these transactions were registered as "Failed"?
- Chart the fluctuations of the number of Succeeded and Failed transactions over time since 2022.
- We tried to compare the number of transactions in the Near network with other networks based on the data in the Flipsidecrypto database.
Summery Results
A Summary of the Status of Transactions in the Near Network
Visuals of 1 to 8 and table 1, summarizes the status of transactions in the Near network since 2022. The total number of transactions performed from the mentioned date is 119.7m number. Of this total transactions, 100.8m transactions were successful (84.2%) and the number 18.9m transactions have failed (15.8%). The average number of total transactions is 415 per minute, average number of successful transactions during this period is 350 per minute and in contrast, the average number of failed transactions is 66 per minute.
Conclusion
Blockchain performance can be measured as transactions per minute and this report that we investigated on Near Blockchain Speed is based on the above definition.
Using the flipside_prod_db.mdao_near.transactions table and according to the queries written in this research, we reached interesting results regarding the speed and status of transactions in the Near Protocol and compared it with the four other networks: Ethereum, Polygon, Flow, and Solana. It should be noted that the queries of this report are based on the time of since 2022.
The results are summarized as follows:
- The average number of transactions performed in the Near Protocol has been 415 transactions per minute, of which an average of 350 successful transactions (84.2%) and 66 transactions (15.8%) failed (Vis 1 to 8).
- We extracted the absolute values of the status of transactions in the Near Protocol according to Table 1. The highest number of successful and failed transactions have been 5884 and 7303, respectively, and the lowest amount of successful and failed transactions have been 17 and 1 transactions per minute, respectively.
- In Figures 9 to 20, we depicted the general trends of transactions performed in the Near Protocol in four timeframes of 1, 10, 60 minutes, and daily. These graphs are based on three indicators: Total Transactions, Number of Successful Transactions, and Number of Failed Transactions over time.
- In the previous 11 charts, we have seen sharp fluctuations in the number of transactions in the period from April 8th to May 11st. the number of failed transactions significantly went up.
- In general, the status of the Near Protocol in terms of transaction execution status is such that when the number of transactions increases, the number of Failed transactions raised.
- In Vis 17 and 18, we conclude that when the total number of transactions reaches less than 1000 per minute, the network experiences the highest Failed transaction rate.
- Successful network transactions since 2022, have been relatively stable, although in there have been fluctuations from the April 8th to 11st of May.
- Again in Vis 19 we see that with the increase in the number of transactions, the number of Failed transactions in the Near Protocol has raised.
- Referring to Figure 20, we find that the maximum volume of Failed transactions is between 40 and 80 per minute, if the total number of transactions is approximately below 1000 per minute.
- Table 2 summarizes the comparison of transaction execution status in 5 networks of Near, Ethereum, Polygon, Flow, and Solana. According to the results obtained in this table and also Figures 20 to 24, these 5 networks can be ranked in terms of Failed transactions in the following order:
A. Solana B. Near C. Flow D. Polygon E. Ethereum
About:
-
Author: HaM☰d
\
-
Discord: 0xHaM☰d#8391
\
-
Twitter: @arjmandi_hamed
\
-
Email: h_arjmandi2012@yahoo.com
\
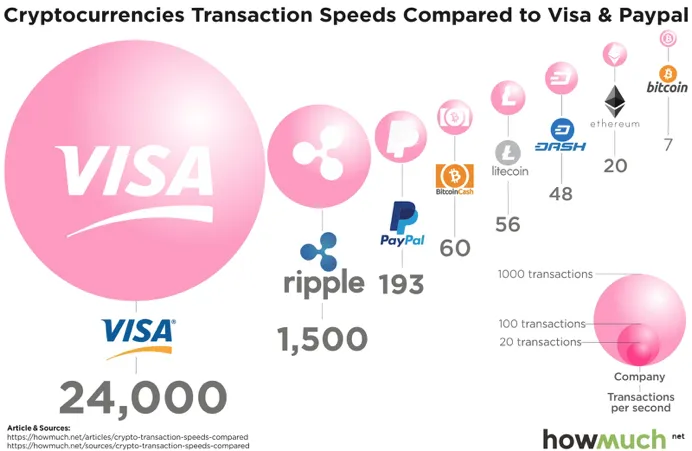
Q5. How does NEAR stock up to other L1s in terms of speed and performance?
How fast is NEAR, and compare it with other blockchain speeds in terms of transactions per minute and percentage of transactions that fail.
Image Source: (hire)
Vis 19 reveals interesting results. In this chart, we calculate and plot the Average Cumulative Sum of the Number of Failed Transactions over time. After a sharp decline at the beginning of the research period (01-02-2022) and after about Jan 18, we see a kind of relative stability in the registration of Failed transactions (it has fluctuated between about 10 to 40 Failed transactions). However, there is a peak in the chart from April 8th to May 11.
Also, simultaneously compares the cumulative average of Failed transactions with the total number of transactions. It is clear that with the increase in the total number of transactions, the number of Failed transactions has Stability.
In Vis 20, we removed time periods and transferred the total number of transactions to the X-axis. What can be deduced from this chart is that the most Failed transactions (between 40 and 80 transactions per minute) occurred when the total number of transactions per hour was less than 1K. Pay special attention to the compaction of the circles in this range.
Table 1:
Certainly, during the study period, there are absolute values in terms of Maximum and Minimum number of successful and failed transactions. We tried to find the date of occurrences and the number of these absolute values. This information is shown in Table 1.
Near Protocol has been able to execute 5,884 transactions per minute out of 5,910 transactions successfully on 2022-03-16 10:55, while on 2022-04-01 7:30, it has not been able to execute 7,303 transactions per minute out of 8,096 transactions successfully.
On 2022-03-21 2:13 out of 19 transactions per minute, it was able to execute 17 transactions successfully, and on 2022-02-03 4:24 out of 124 transactions per minute, only 1 transaction failed.
Charts of Transactions Execution Status in Near Protocol in Different Time Intervals
Charts 9 to 12 show the status of transactions executed in the Near Protocol based on three indicators: Total Number of Transactions, Number of Succeeded Transactions and Number of Failed Transactions in different time periods (1 minute to daily) and Area type. The reason for drawing these graphs in different timeframes is to reduce the compression of the lines in the graphs of short time intervals and also to get the results quickly from them.
Vis 1 shows the trend of changes of the three mentioned indicators in 1-minute intervals and in normalized mode. It seems that strange fluctuations occurred in this network from May 20th to date.
In Visuals of 13 - 14, the daily transactions per minute and cumulative growth, are shown.
In period time of April 10th to May 13th, an high volume in Failure transactions count are observable and in cumulative growth after May 10th, it went on a side momentum. In contract on total count of transactions and successful transactions after that date went on a downward trend to date.
Comparision Different Status of Transactions Overtime
Vis 15 shows the Failed Transactions Rate (Right Y axis) versus the Total Transactions per minute (Left Y axis) on an daily basis ( X axis). This chart shows that whenever the number of transactions increases at once, the percentage of their Failed execution transactions raised.
Vis 16 shows the Failed Transactions Rate (Right Y axis) versus the Succeeded Transactions per minute (Left Y axis) on an daily basis ( X axis). normally these two metrics had a negative correlation.
Vis 17 &18 show the Failed Transaction Rate based on the Total Transactions. The difference between charts 17 and 18 is in Marker Size. There is not much difference in terms of results in these two axes. It is quite obvious that the distribution rate of failed transactions is going high when the number of transactions is more than about 1k.
Comparing the Status of Near Protocol Transactions with Four Networks of Solana, Polygon, Ethereum, and Flow
Table 2 summarizes the statistical status of transactions in the various aforementioned networks. One of the important columns of this table is the %(Failed/ Total) Transactions and %(Succeeded / Total) Transactions columns. This columns actually shows the percentage of Failed & successful transactions to total transactions. As of this, we can see that Solana is ranked first, Near second, Flow third, Polygon fourth, and finally Ethereum is ranked fifth in failed transactions. and in the other hand, on successful transactions, Ethereum is ranked first, Polygon second, Flow third, Near fourth, and finally Solana is ranked fifth.
The largest number of transactions during the period of this research (since 2022) occurred in the Solana network. Accordingly, the highest number of successful and failed transactions has occurred in the same network.
Visuals 21 to 24 shows the comparative trend of all transactions as well as the Failed transactions of the Near Protocol against the four networks of Solana, Polygon, Ethereum, and Flow.
(gray bars vs. red bars (rate) - green line vs. blue line (total transactions)).
According to Vis 21, it can be concluded that the total transactions and fail rate of transactions in the Ethereum network are higher and lower than in the Near Protocol in all time, respectively.
Vis 22 shows that the Polygon network is higher to Near in terms of Failed transaction execution since 2022 to firth of April, then it significantly went into below of Near in failed transactions after that date. Despite the higher number of total transactions in the Polygon network, we see that the percentage of Failed execution of transactions in this network is lower than the Near Protocol.
On July 4th, a drop on Polygon network transactions are observable, that we knew that on that date Polygon network went down for a day.
Vis 24 shows that the Failure rate of transactions, as of this daily count of Failed transactions are high in flow network than Near protocol since 2022 till Jun 10th and after that failed transactions rate on Near goes up to higher than Flow network to date. Although the number of transactions executed in the Flow network is much higher than in the Near protocol from May 13th to date.
Vis 23 shows the Failure rate of transactions, as of this In overall, daily count of Failed transactions are significantly high in Near protocol than Solana network. Although the number of transactions executed in the Solana network is much higher than in the Near protocol.