Quix vs Magic Eden vs OpenSea
Introduction
Non-fungible token (or NFTs for short) are a special type of digital asset that has recently experienced a very booming market. There are markets for creating, managing, buying and selling these assets, the largest of which is Opensea.
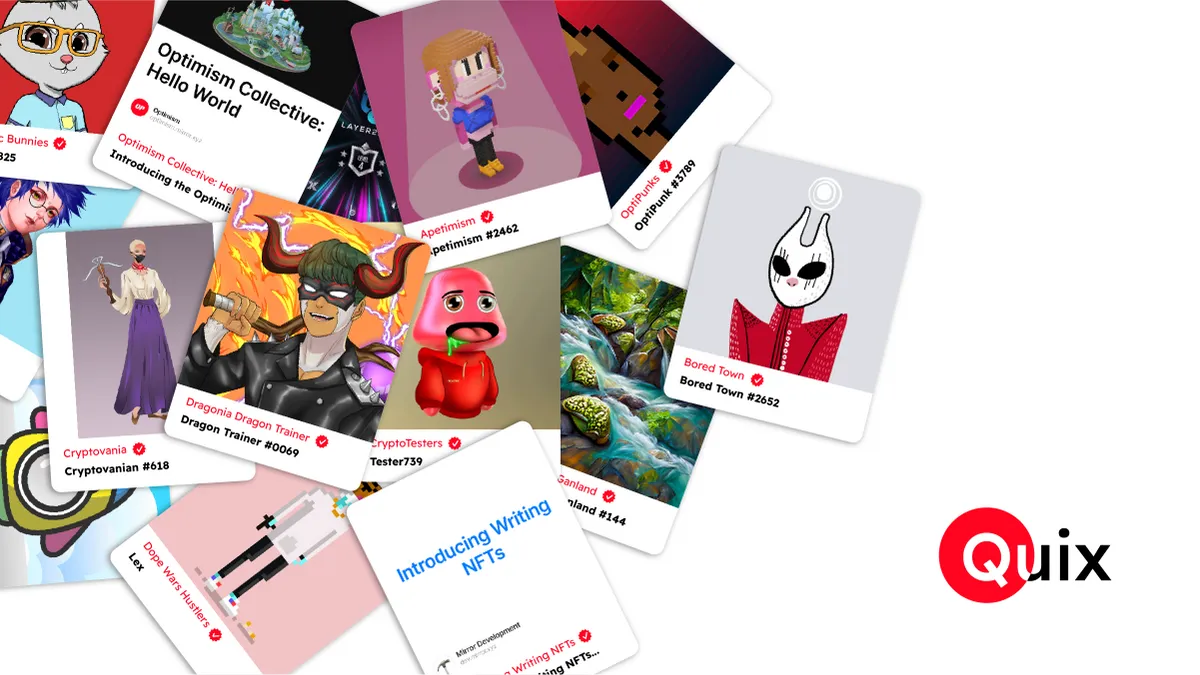
quixotic.io. Quixotic, the largest NFT marketplace on Optimism. Discover, collect, and sell digital items on the largest NFT marketplace on Optimism.
Opensea is an NFT trading market founded in 2017 by Devin Finzer and Alex Atallah. From the beginning until recently, all NFTs traded in this marketplace were based on Ethereum. But after much speculation and news, on April 6, 2022, the possibility of trading Solana-based NFTs in Opensea was made possible, which is a big step in the growth of this market.
Method
In the current dashboard I tries to calculate the following metrics on three mentioned NFTs marketplaces by nft_sales table in each network over two period time, since last July and 2022.
> * The count of sales transactions over time > * The count of unique sellers and buyers over time > * The amount of sales volume in $USD over time
and at the end have highlighted the 5 most popular NFT collections for each marketplace since last July in terms of sales volume and sales transaction count.
Also I found New Users and New users > 1 tx Active, which implies to users that have had more than 1 transactions on NFT marketplaces on all three networks, and other metrics such as: New Users > 1 Day Active which implies to users that have had more than 1 day Interaction on NFT marketplaces, New NFT Interactors and etc. by following query.
 count(distinct case when tx_counts > 1 then FROM_ADDRESS end) as "New Users > 1 Tx Active",
 count(distinct case when days_active > 1 then FROM_ADDRESS end) as "New Users > 1 Day Active",
 count(distinct FROM_ADDRESS) as "New Users", -- by wallets active
 count(distinct nft_tx_signer) as "New NFT Interactors", -- any tx with NFT
 count(distinct nft_buyers) as "New NFT Buyers", -- only buy_nft method
 "New NFT Interactors"/"New Users"*100 as "% New Users Interacting with NFT",
 "New NFT Buyers"/"New Users"*100 as "% New Users Buying NFT",-- cumulative users
 sum("New Users") over (order by date) as "Cumulative New Users",
 sum("New Users > 1 Day Active") over (order by date) as "Cumulative New Users > 1 Day Active",
 sum("New NFT Interactors") over (order by date) as "Cumulative NFT Interactors",
 sum("New NFT Buyers") over (order by date) as "Cumulative NFT Buyers",
 "Cumulative NFT Interactors"/"Cumulative New Users"*100 as "% Cumulative NFT Interactors",
 "Cumulative NFT Buyers"/"Cumulative New Users"*100 as "% Cumulative NFT Users"
✍🏻 Conclusion
Conclusion
-
Compared to OpenSea and Magic Eden, the two major NFT platforms, it is clear that OpenSea and Magic Eden have been significantly outperforming Quix.
-
In terms of NFT sales volume, sales transactions, and number of buyers & Sellers, Quix accounts for less than 1% of the market share.
-
Financial Deals Made on the Magic Eden Since the beginning of 2022, growth has been consistent, and in July of that year, Magic Eden's transactions surpassed OpenSea's.
-
However, in 2022, OpenSea has around twice as many distinct wallets as Magic Eden and more than 50 times as many as Quix.
\
-
art_blocks, ABC and optimistic explorerare the most popular NFT collections (in terms of sales tx cout) for Opensea, Magic Esen and Quix, respectively.
-
Compared to OpenSea and Magic Eden, Quix's top 5 NFT collections saw a lower rate of turnover.
This suggests that Quix users who purchased the most popular 5 collections are more likely to keep their NFT than OpenSea and Magic Eden users who purchased the most popular 5 collections.
-
Share of new user buying & interacting NFT on Quix is too significantly than other metric, that I think, it indicate the attention to this marketplace in an era was growth.
-
About:
-
Author: HaM☰d
\
-
Discord: 0xHaM☰d#8391
\
-
Twitter: @arjmandi_hamed
\
-
Email: h_arjmandi2012@yahoo.com
Quix vs Magic Eden vs OpenSea
Create a dashboard highlighting at least 3 metrics comparing marketplace performance and adoption between Quix (formerly Quixotic) on Optimism, Magic Eden on Solana, and OpenSea on Ethereum, since July of this year. \n
What has been the rate of change of these metrics since the start of the new year and are there any signs of growth of a certain marketplace or ecosystem of NFTs? Highlight the 5 most popular NFT collections for each marketplace over that timeframe in terms of sales volume. Is the turnover rate (number of transactions) for collections on Quix noticeably higher than on OpenSea and Magic Eden? Provide some insights on these findings.
Hey there 👋!
Firstly, I appreciate you sticking with it until the conclusion.
I’m Hamed, Ph.D. In Civil Engineering and interested in data science.
I've made many similar dashboards and visualizations since I started at Flipside in January.
Please have a look at my various contact information and let me know what you think.
:telescope: Findings:
In the above tables, an overall view of selling NFTs on the mentioned marketplaces since 2022 and last July is shown. These metrics are then visualized using charts in the sections that follow.
The quantity of sales is depicted in the first two charts in daily. You can observe that the number of Quix sales transactions peaked on July 25 and has since decreased. Also, starting in early July, Magic Eden (Blue Line) overtook Opensea in terms of the total number of daily sales transactions, while having started the year off in a lower position than Opensea.
Following two bar charts the daily count of unique sellers is shown.
as can be seen this metric are in a downward trend since 2022.
:telescope: Findings:
The quantity of unique buyers is depicted in the first two right side charts in daily. You can observed that the number of Quix’s buyers count isn’t significant in comparision two others.
The count of NFT collections over time is shown, too. and can be observed that Magic Eden was in the top over since 2022 and on Sep 5th, the highest count of NFT collections count was recorded.
:telescope: Findings:
In the following the cumulative of above assessed metrics are depict.
as of these charts can be observed that Magic Eden charts is sharpen in cumulative growth than two others. also on the last two charts the share of sales count over time is shown and can be seen that Magic Eden is in an increasingly trend since 2022.
:telescope: Findings:
In this section top 5 popular collections on Magic Eden based on Volume in SOL and count of transactions are depict (Since July).
ABC with 57.4% of volume and 35.2% of sales transactions is the top popular collection that followed by Dege Town in volume and Sengoku Degens in sales transactions count with 13.6% and 17.1%, respectively.
:telescope: Findings:
In this section top 5 popular collections on Quix based on Volume in SOL and count of transactions are depict (Since July).
Optipunk with 41.8% of volume and Optimistic expelore with 64.8% of sales transactions are the top popular collection that followed by apetimism in volume and mirror in sales transactions count with 37% and 10.6%, respectively.
:telescope: Findings:
In this section top 5 popular collections on Opensea based on Volume in SOL and count of transactions are depict (Since July).
art_blocks with 72% of volume and raribles_nfts with 60% of sales transactions are the top popular collection that followed by MAYC in volume and art_blocks in sales transactions count with 11.4% and 33.5%, respectively.
:telescope: Findings:
This section’s charts shows the % of new users who eventually interact with NFTs over time.
- Generally, we see that there was a substantially higher % of users who interact (==mint==, ==list==, ==transfer==, ==buy==) with NFT over buying them
- The downtrend since 2022 was likely due to the unusually high volume of wallets created, most of which were only online for a day
- Interestingly, NFT adoption was not consistent across time , this tells that there are bear-bull phases of NFT adoption on all three networks since 2022.
- While the trend of NFT buyers and interactors seems to be similar in trend, we saw a split towards early 2022
- While the % of buyers steadily declined in Quix and Opensea, we still saw a lot of variation in users who interacted with NFTs, but in Magic Eden the % of buyers steadily inceased.
- This suggests that new users in this period may have minted or transferred NFTs but did not buy any from secondary marketplaces.
- Growth of NFT Users (Interactions and Purchase) surged from Jan to May on Quix & Magic Eden and to date on Opensea.
- Across both categories, we saw the cumulative growth going steeper between January and May 2022
:telescope: Findings:
In this section, as excepted we can see that new users in NFTs interaction on Opensea networks are more higher than Optimism & Magic Eden, but this metric and new users buying NFT in comparision to other metric is too meaningful for Quix that shows the growth of adoption of this platform amongst new users.