Solana dex - Users Retention
Now with the labels, we can match them back to the solana.defi_fact_swap table by performing a join to identify and categorize these users.
Subsequently, we can analyze either power users or normies by applying a filter based on the user's preference.
For power users, observe the remarkable retention! This underscores the importance of segmentation, steering away from a single rate for analysis. Interestingly, normies significantly contribute to the overall blended retention rate.
Comparing volumes, normies fall behind power users. However, their volume retention is comparable, indicating their relative spending propensity despite lower wallet sizes.
Power Users vs Normies: Who's returning and driving substantial trade volume?
This time, let's filter for specific users—distinguishing between power users and normies.
We'll then conduct individual cohort retention studies on them.
The premise remains the same as before. Whether we study by user, metric, or event, the underlying query remains consistent.
The key difference is adding a label (when possible) to these addresses.
Creating a Pareto Chart
-
Group the data by the last 365 day date, to calculate the total traded volume for each address.
-
Calculate the cumulative count of addresses, starting with the address having the highest volume.
-
Normalize the cumulative sum of each address by dividing it by the total volume of all addresses.
-
Apply labels: Addresses representing less than 0.8% of the total sum are labeled as "Power," while others are labeled as "Normie."
Optional: Utilize dense_rank() to rank addresses by total volume in descending order and generate a chart for validation.
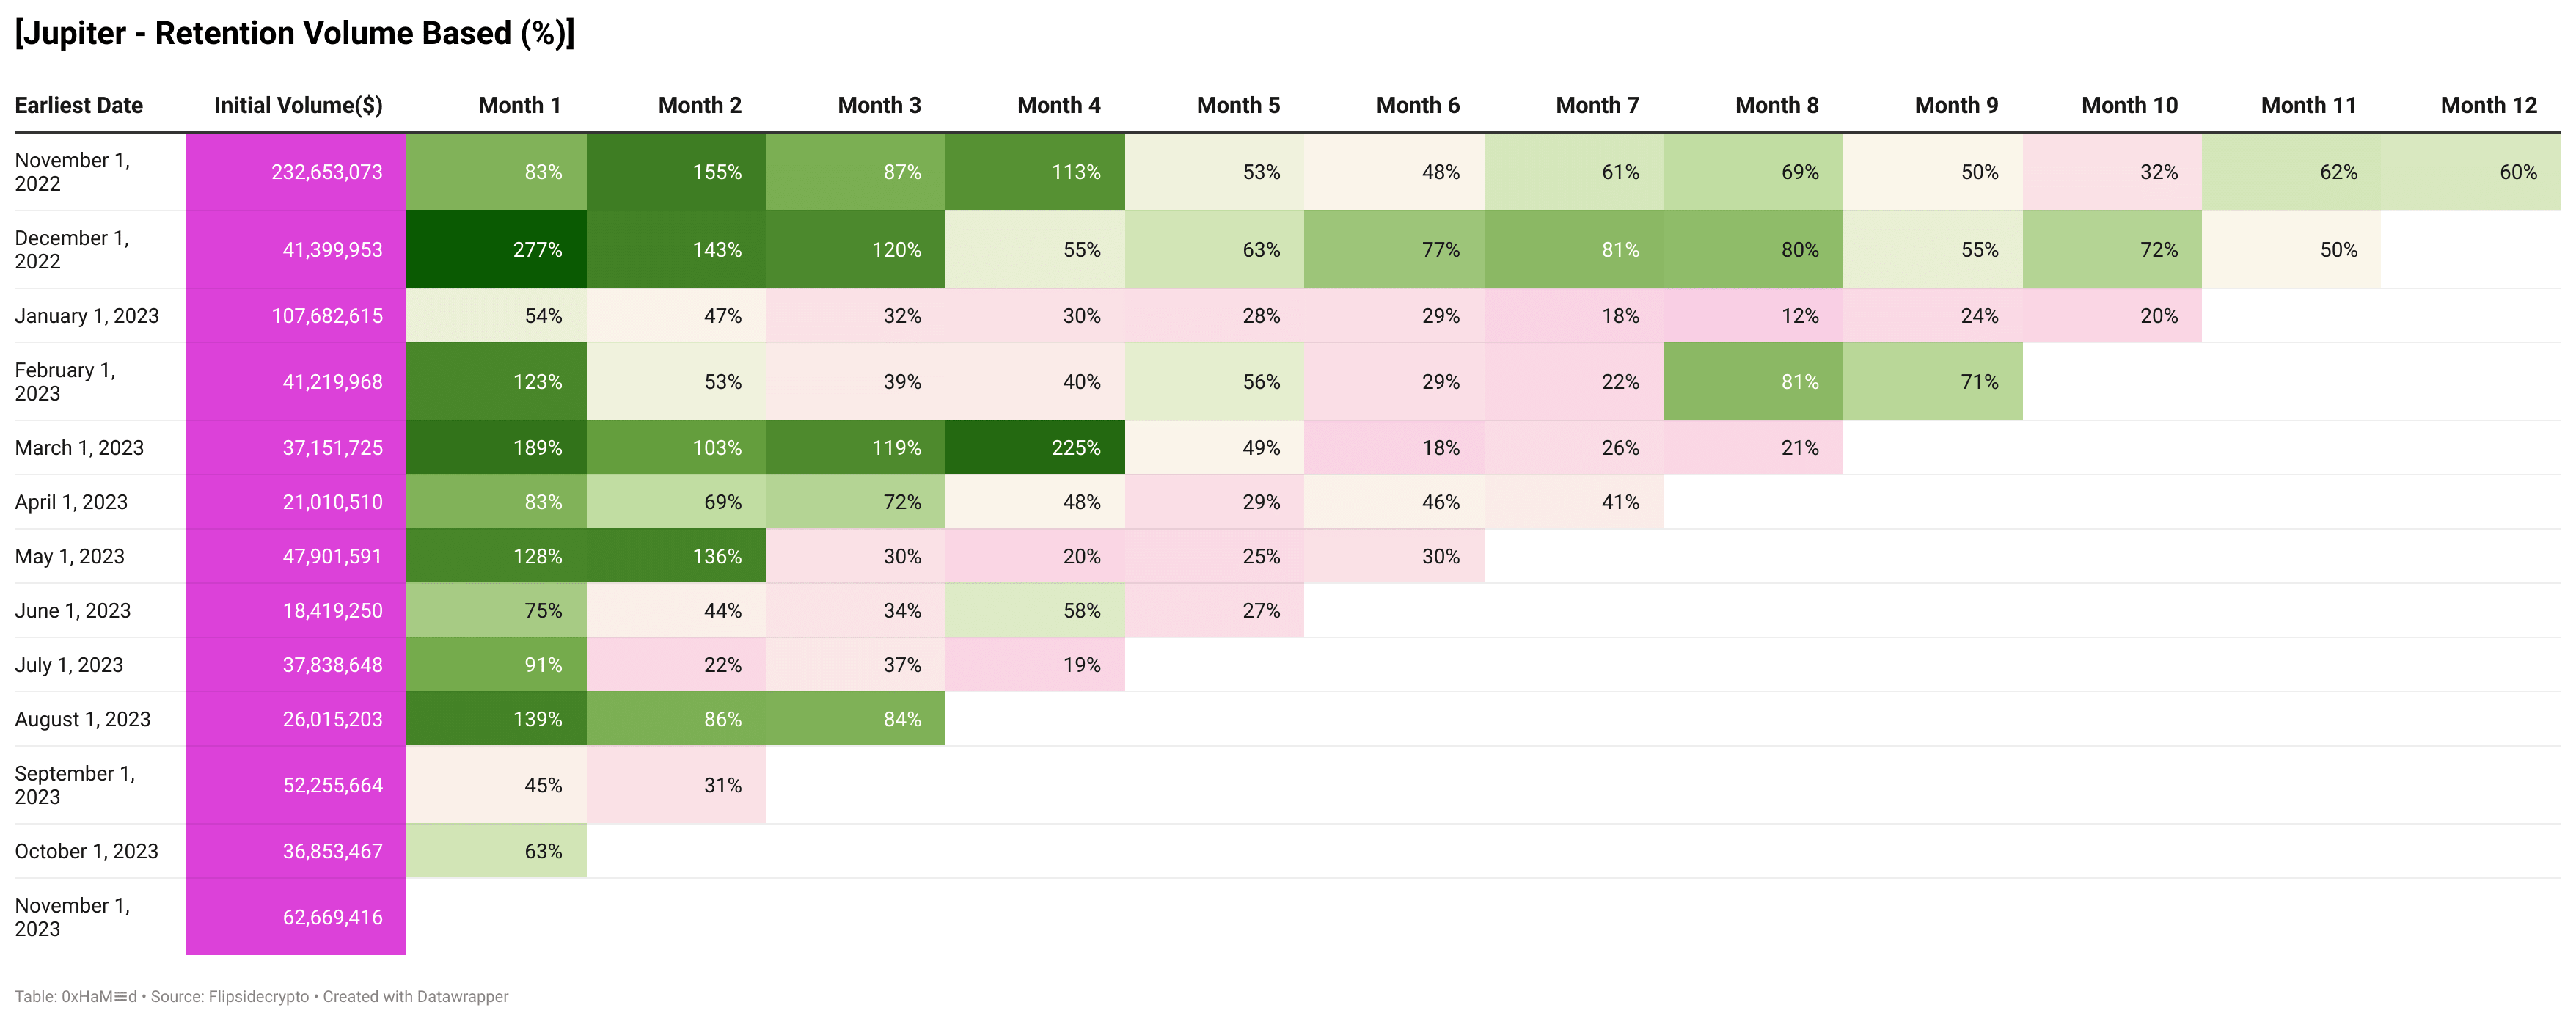
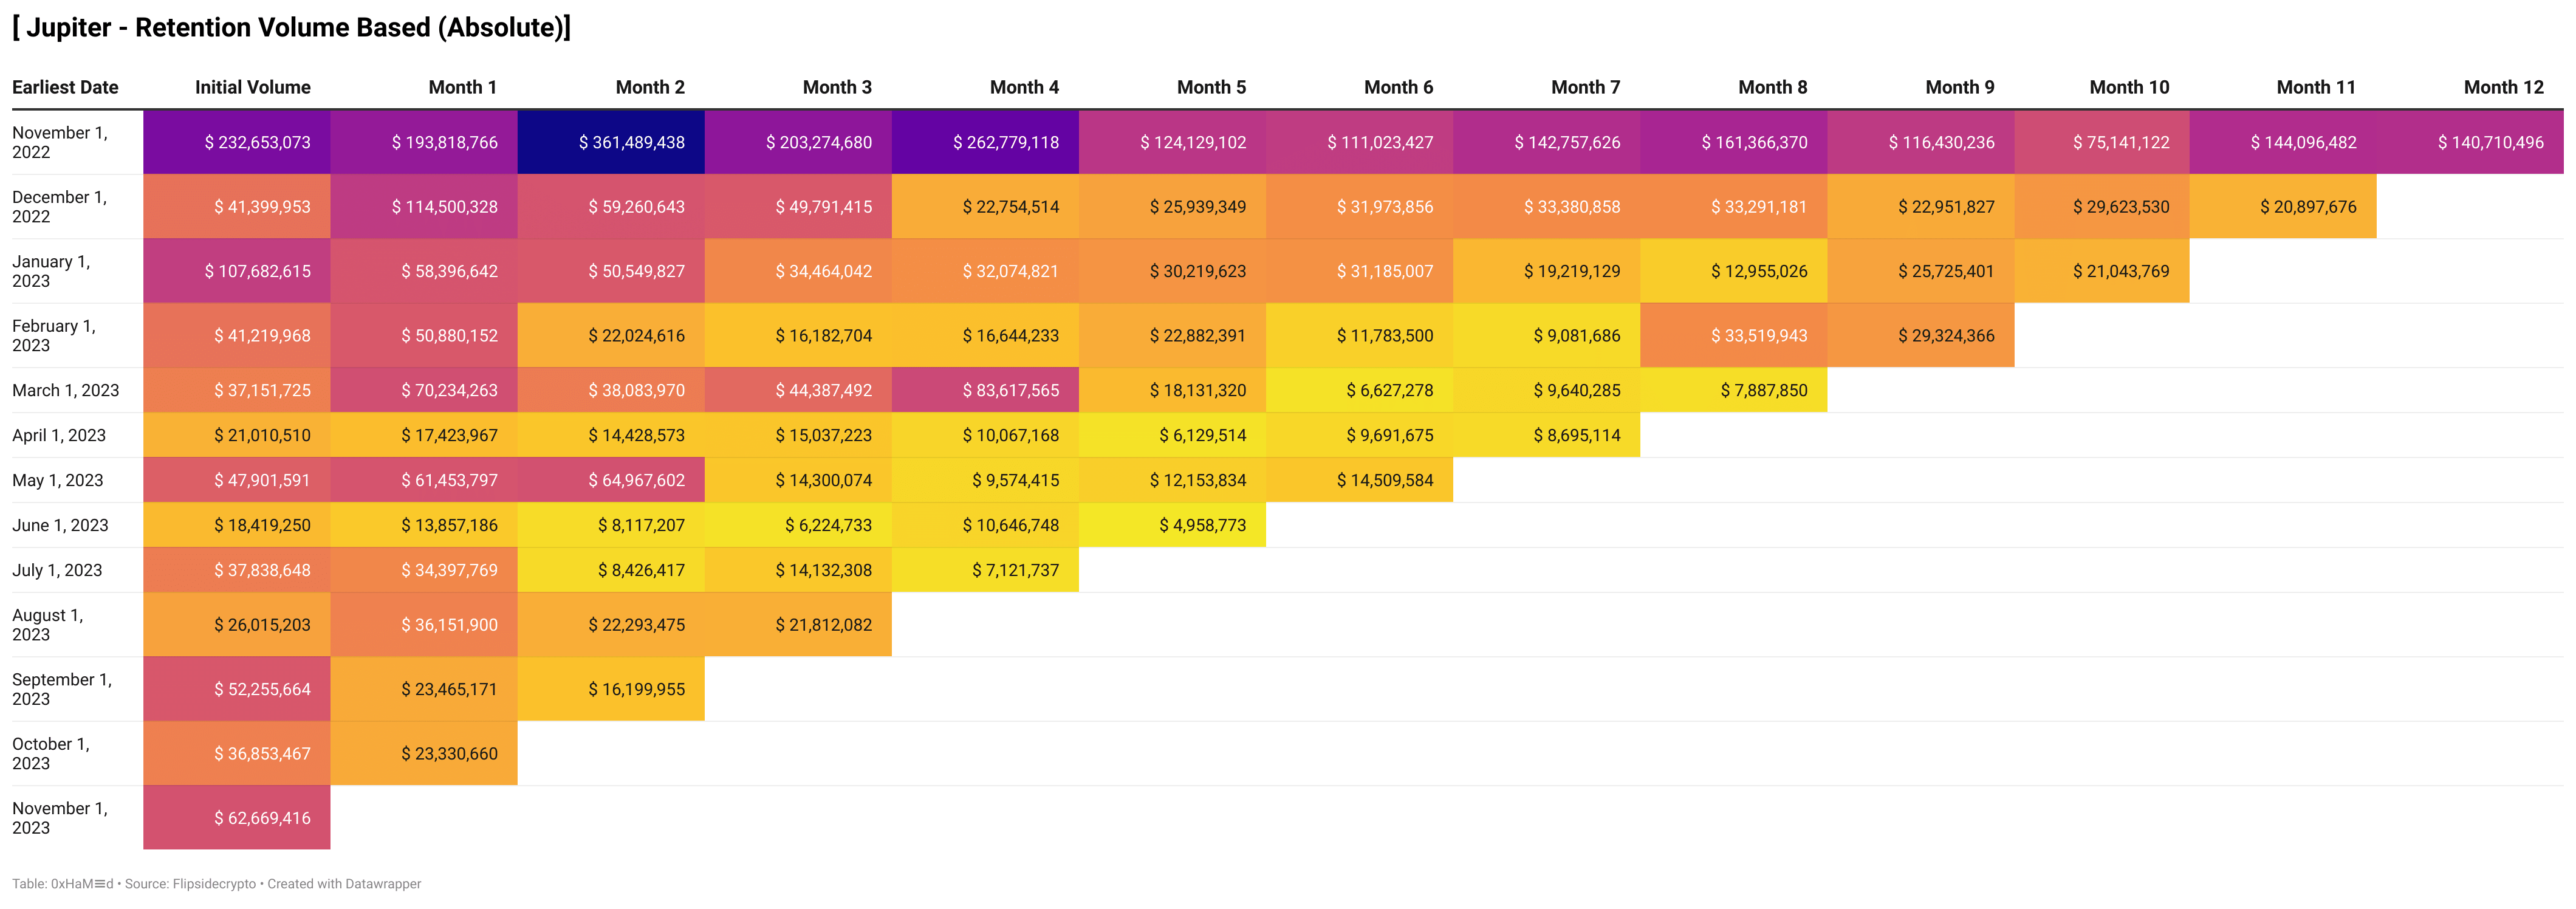
Cohort by Metric (Volume USD)
We analyze spending trends by Jupiter trade volume instead of user count.
-
This query considers initial spend volume in the first month a user engages, tracking subsequent spending behavior.
-
Ideally, we aim for growth in spending, often exceeding 100%. Notably, for the 2022-11 and 2023-03 cohorts, retained volume remains consistently high, indicating heightened interest of the platform.
The table and chart provided offer insights into user counts based on the number of weeks they remained active, illustrating their level of engagement during the first week and subsequent weeks.
Analyzing this data and the corresponding visualization, a notable observation is the high retention rate among users who were active for zero weeks. This indicates that a significant majority of users engaged with the platform for only the first week and did not extend their interaction beyond. It is evident that encouraging continued engagement beyond the initial week is a critical aspect for enhancing overall user retention and fostering a sustained user base within the platform.
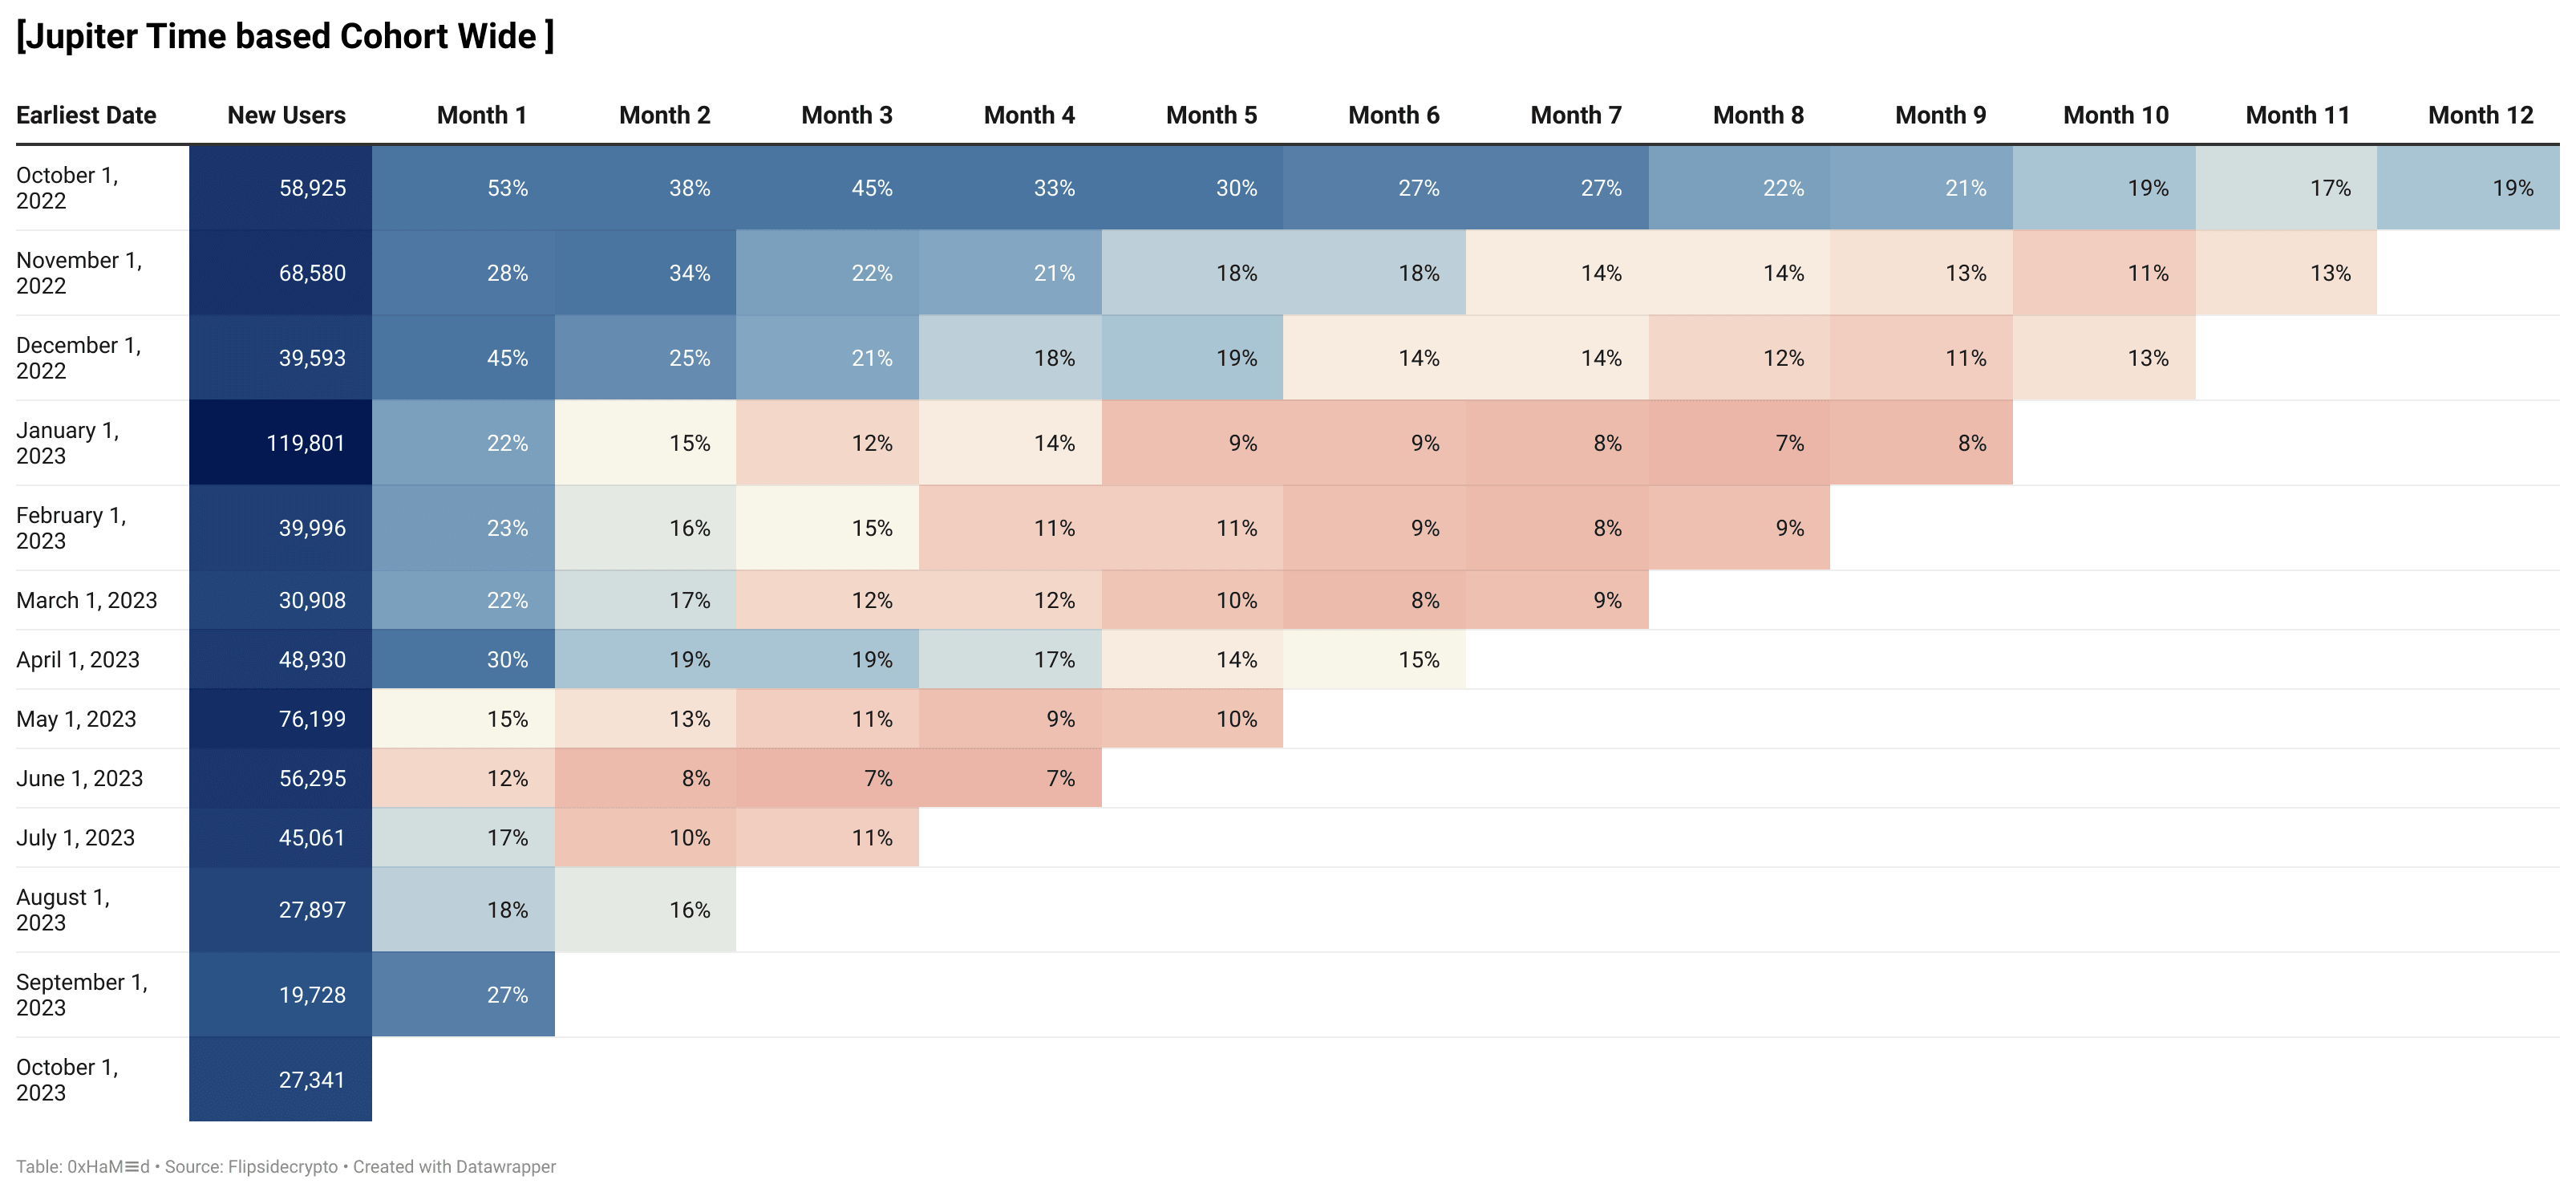
Let's analyze Jupiter user retention over last 365 days.
The common retention table, usually segmented monthly, as we done here.
-
Horizontal analysis pinpoints exceptional cohorts, such as the strong retention in the 2022-10 and 2022-11 groups, potentially early loyal adopters.
-
Vertical analysis uncovers trends and user churn points. Examining the 'new users' column tracks user influx.
-
Diagonal analysis provides an overall product performance assessment across all cohorts, crucial for understanding how well the product is faring.
Query link
Query link
Query link
Sojourner or Habitant
We filter out wallets with more than 10,000 transaction counts to exclude bots/contracts.
Most of the individuals were actually just sojourners. The chart above displays the cumulative count of new wallets based on the number of days they have been active. From the chart, we observe a graduly decline in new users from those online for a day to those online for more days, one-furth of users are for 14 days. (472K → 143K).
When we examine users online for more than 50 days, this number drops to approximately 25k. This suggests that the majority of the individuals were more like habitant, stay with the platform after 50 days of visiting.
In the charts below, we identified new users—those who transacted across the Jupiter for the first time. Users with an active duration greater than or equal to 7 days and a last active duration less than or equal to 7 days are considered new active users. According to this chart, the count of these users is significantly low and has decreased over time, with 43.1K new active users out of 999.2K.