Terra - 11. Back to Basics: Account Activity
The question of “active wallets” faces every ecosystem. Let’s investigate this question for Terra — and go beyond the “one transaction in 30 days” approach! Define what an active, high quality user looks like and how it can be measured. Assess how many active users exist on Terra, according to your definition. Additionally, provide a few brief, specific ideas to attract additional users, as well as an assessment of what it would cost to implement these ideas. What is the acquisition cost for a high-value user, according to your recommendations?
✨Introduction
An active, high-quality user on Terra can be defined as someone who regularly uses the network for transactions, staking, and governance activities. This can be measured by analyzing on-chain data such as transaction volume, staking activity, and participation in governance proposals.
User retention, also known as “queue retention”, is a key indicator of blockchain and application growth. User retention looks at first-time users over a period of time (usually a month or week) and calculates the percentage of users who return in subsequent periods. User retention may measure retention of user transactions, transactions of a subset of users, or specific behavior (eg purchase of NFTs, use of special features, etc)[1].
Cohort analysis is a method for analyzing user retention by grouping users based on when they joined the platform or made their first transaction. This allows you to track the behavior of a specific group of users over time and understand how retention changes for different groups.
🛠️ Method
In the current dashboard, I tried to evaluate the Terra users' interactions to find the active unique users by their activities and transaction count on each action over time. \n First, I evaluated the new users, calculating the total number of transactions for each user and categorizing them as follows:
when tx_cnt = 1 then 'Tester Usrs. only 1 Tx'
when tx_cnt BETWEEN 2 and 10 then 'Usrs. 2 ~ 10 Tx'
when tx_cnt BETWEEN 10 and 50 then 'Active Usrs. 10 ~ 50 Tx'
when tx_cnt BETWEEN 50 and 100 then 'More Active Usrs. 50 ~ 100 Tx'
when tx_cnt BETWEEN 100 and 500 then 'Most Active Usrs. 100 ~ 500 Tx'
when tx_cnt BETWEEN 500 and 1000 then 'High Active Usrs. 500 ~ 1K Tx'
when tx_cnt > 1000 then 'Supper Active Usrs. > 1K Tx'
In the next step I defined users by using @BlumbergKellen definition of bot as published in this tweet and this query from this dashboard:
- more than 3 different minutes with more than 40 transactions or more than 3 different hours with more than 240 transactions
The cohort analysis was used to track user retention.
Finally, the number of transactions made by users for individual actions is calculated and defined based on their activities in each action individually and in multi-action to identify cross-action users who have participated in more than two or more actions over time.
✍️ Conclusion
To summarize:
The Terra blockchain ecosystem has shown high initial interest, but faces challenges in retaining and engaging users. To activate current users and drive growth in the ecosystem, it is suggested to introduce reward programs, enhance DeFi offerings, promote NFT offerings, and increase developer activity. This may require investments, but has the potential to increase user engagement.
To attract new users, marketing and outreach, diversifying the ecosystem, and community building are recommended. The cost of implementing these strategies will vary based on the scope and scale of the initiatives.
Defining an active, high-quality user and measuring their presence on Terra can help assess the current state of the ecosystem and identify opportunities for growth.
In conclusion, attracting and retaining users is crucial for the success of the Terra blockchain ecosystem. A combination of active user engagement initiatives and targeted acquisition strategies can drive growth and adoption.
Hey there 👋!
Firstly, I appreciate you sticking with it until the conclusion.
I'm Hamed, a civil engineering Ph.D.
student interested in data analysis.
I've made many similar dashboards and visualizations since I started at Flipside in January.
Please take a look at my various contact details and let me know what you think.
💻 About:
Author: HaM☰d
Discord: 0xHaM☰d#8391
Twitter: @arjmandi_hamed
Email: h_arjmandi2012@yahoo.com
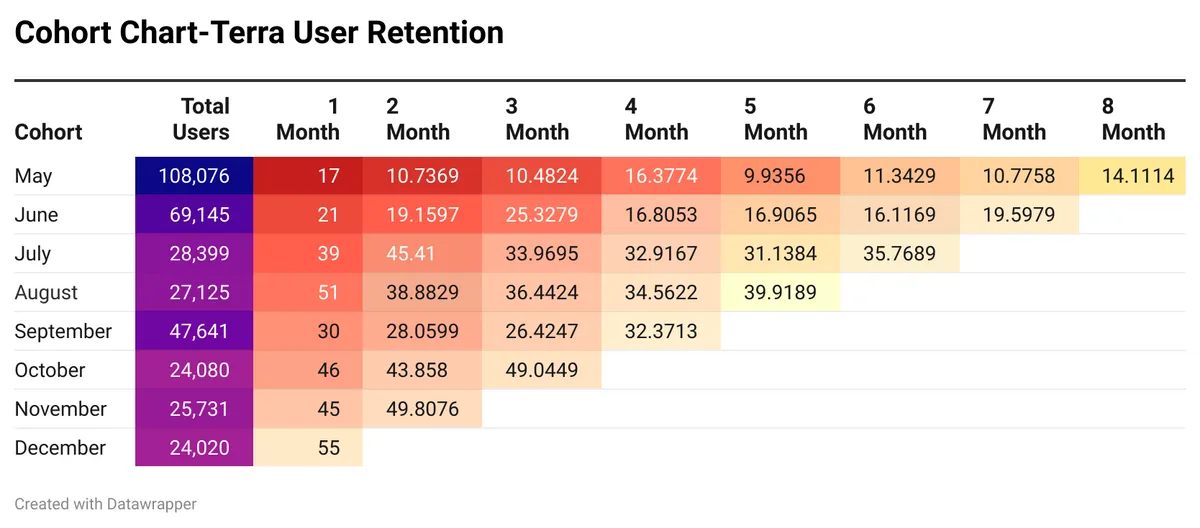
🔥 Terra User Retention
Charts Guide
There is a specific chart for Terra ecosystem contains the since Terra 2 launching date.
reading vertically (up to down) shows the product lifetime. comparing different cohorts at the same stage in their life cycle — we can see what % of people in a cohort are coming back to the chain after 3 months and so on.
reading horizontally (left to right) shows the lifetime — seeing the long-term relationship with people in cohort — to ascertain how long people are coming back and how strong or how valuable that cohort is.
cohort column is the month that users had a transaction in the chain and we want to see how many of them had another transaction in the next 1 month, 2 months, etc.
The total Users Column is the number of total active users in the cohort month.
for example in the May cohort month, 108K unique users had at least a transaction in the Terra chain. 1 month after (June) 17% of 108K users in May again transacted in the chain. so 17% of May users were retained in the next month but in the next 2 months, 10.7% of 108K users were retained.
until August the retention rate was so high and reached 51% one month after August, which means that 51% of 28K users in August, were retained in September again and transacted in the Terra chain again. Although, the retention rate dropped significantly in September, but raised again to 55 over three months later. the users that were in the October & November are the most loyal users and 49 & 49.8% of these months users had other transactions 3 & 2 months later, respectively.
The Terra Retention Query: Link
🔎Findings:
The Terra ecosystem analysis shows that the majority of users are active only on Staking (65%) and a smaller portion are active on both Staking and Swapping (7.85%). A limited number of users (2.34% equal to 6.75K) are active on all types of transactions. The cumulative number of active users for different actions can be seen in the line chart. The bar chart and PIE graph show the weekly count and cumulative count of active users for a selected action, with NFT being the default option.
🔎Findings:
The available data allows us to draw the following conclusions about the Terra blockchain:
Approximately 130 thousand wallets were established in the first two weeks of the chain being online, demonstrating a strong level of initial interest in the platform.
Wallet creations have been declining over time, which may indicate a leveling off of the platform's rate of growth.
A large percentage of users do not make frequent purchases, since 53.3% of wallets established have only performed 1 transaction.
Users' interest in the platform seems to be fleeting(As of graphs below), 68.6% of wallets have been in use for less than a week.
The data as a whole reveals that while Terra has shown rapid uptake and interest, it is having trouble keeping people engaged.

⏳ Ideas to attract additional users
Defining an active, high quality user on Terra may involve factors such as frequency of use, level of engagement, contribution to the ecosystem (such as staking, liquidity provision, or app development), and overall value they bring to the network. Measuring this could involve metrics such as transaction volume, frequency of use of specific apps, and contribution to the ecosystem.
To attract additional users, some suggestions include:
- Marketing and outreach campaigns to raise awareness about Terra and its offerings
- Diversifying the ecosystem with new apps and services to cater to a wider audience
- Introducing reward programs for users who contribute to the network through staking, liquidity provision, or app development
- Enhancing DeFi offerings to provide more value for users who participate in financial services on Terra -The cost of implementing these strategies will vary and depend on the scope and scale of the initiatives. Marketing and outreach campaigns, for example, may require a significant investment in advertising and community building. On the other hand, enhancing DeFi offerings and introducing reward programs may require fewer resources but still require development effort and management.