Aave - How does BTC funding affect rates?

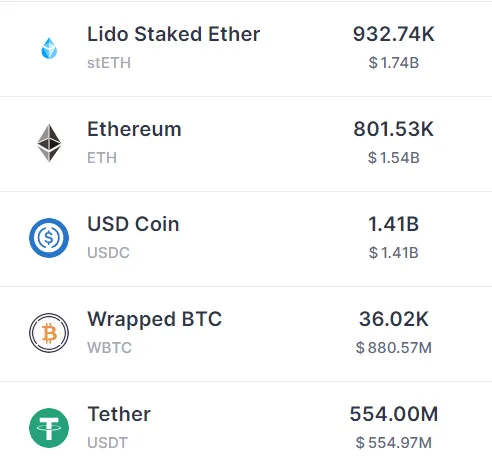
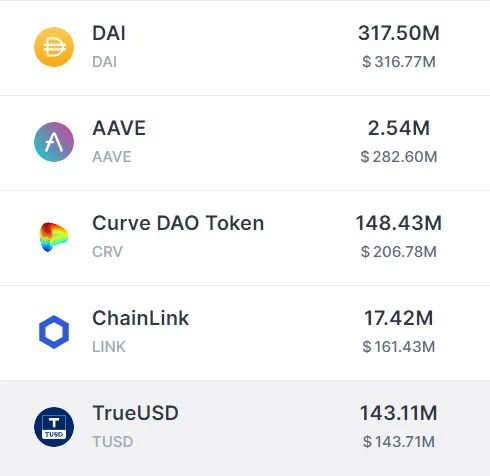
    Show: Supply and lending rates for at least five tokens in Aave V2, and Total amount of Wrapped BTC supplied over time. Provide analysis on the volatility of rates. Measure the correlation between USDC borrow rates and total wBTC supplied. Date Created: 12/8/2022

    In the following dashboard i will present analysis on Aave protocol V2 version on the Ethereum network since that is the biggest market .

    Firstly we will show the supply and lending rates for the top 10 tokens by supply size.

    More info

    db_img
    db_img

    Note: Even though these are the top 10 tokens by supply size there is no borrowing allowed on the stETH and AAVE Tokens which means that all rates for them are 0.

    Loading...
    Loading...
    Loading...
    Loading...
    Loading...
    Loading...

    I will present all the rates bellow splited across 4 stablecoins and 4 non stablecoins % wise.

    WBTC supply in 2022

    Loading...

    USDC rates - WBTC supply Correlation in 2022.

    Loading...
    Loading...

    In the left charts we see a strong correlation between WBTC $ funding and USDC rates both stable and variable.

    In the wbtc supply we see an increase around March and a big decline in mid-June both in usd value and token value.

    We can also see a correlation between the price of WBTC and the amount of tokens supplied.

    In the above charts we see that supply rates are generally higher for non stablecoins and especially CRV probably because of liquidity shortage.

    There is a similar pattern on borrow rates and we see that for non stablecoins variable rates are generally higher than stablecoins and for stable rates also rates are higher on non stablecoins.