Flipside's World Cup of Bounties Side Quest: Sorare Compete With Collectibles

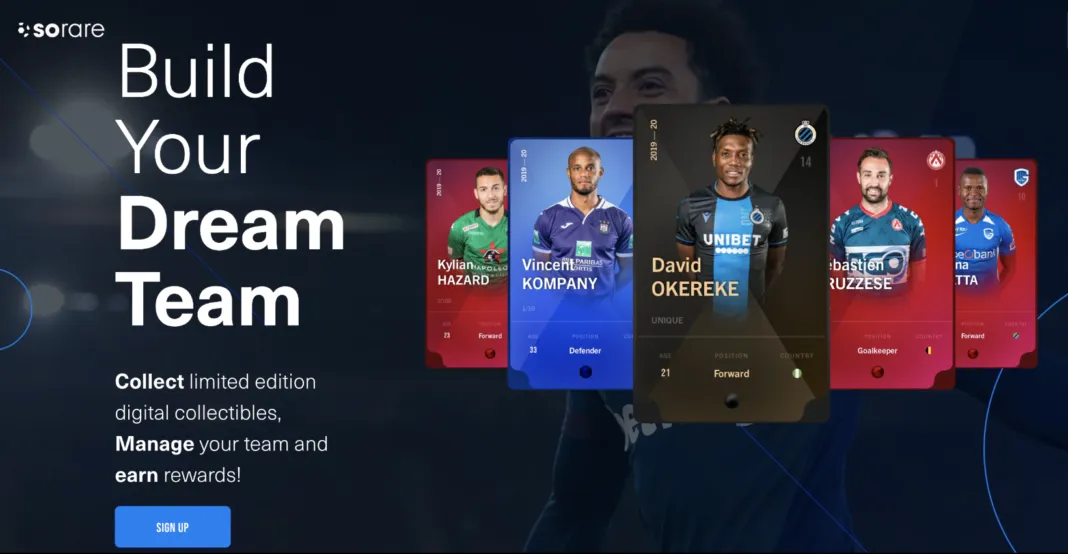
    Sorare is a digital, playables and collectibles platform where users can compete across football, NBA, and MLB in a fantasy sport setting. Build a dashboard that covers the Sorare project: - Statistics on Sorare NFTs being sold on Opensea such as buyers, volume, number of NFTs etc - Transfers and mints over time - Statistics on contract events such as players and clubs added - Provide additional insight into the players and clubs added in from the event inputs.

    Loading...
    Loading...
    Loading...
    Loading...
    Loading...
    Loading...
    Loading...
    Loading...
    Loading...
    Loading...
    Loading...
    Loading...
    Loading...
    Loading...
    Loading...
    Loading...
    Loading...
    Loading...
    Loading...
    Loading...
    Loading...
    Loading...
    Loading...
    Loading...
    Loading...
    Loading...
    Loading...
    Loading...
    Loading...

    INTRODUCTION

    Sorare is an NFT-based competitive fantasy game filled with the world's best soccer leagues and Major League Baseball stars. Sorare taps into the world of fantasy sports leagues and non-fungible tokens (NFTs) to create a blockchain-based game.

    METHODOLOGY

    In this dashboard we will cover statistics on Sorare from NFT Mints, Sales and Transfers.

    On sales we will focus on Opensea which has >99% of the volume.

    DATA SOURCES: Data were taken from Flipside’s Ethereum.core tables.

    db_img
    db_img

    NFT Sales

    NFT Mints

    NFT Transfers

    CONCLUSIONS

    • Sales volume had the strongest months on March 2021, August 2021 and February 2022.

    • There are $200k in sales volume to date.

    • Sales have started to pickup again after they were at pretty low levels.

    • The average NFT price is lower now that it was a few months ago.

    • The most expensive NFT sold is at $13.5k while there are 3 NFTs that have been sold 4 times.

    • Weekly mints were almost 0 after July 2021 but now have picked up again but not at the same levels.

    • Although minters and minted tokens are still pretty low.

    • The weekly transfers stats follow the same pattern being at very low levels now.

      \

    Here we see total metrics about Sales.

    There have been 1420 sales with $199k volume and an average NFT price at $124.

    There are 259 unique sellers and 846 unique buyers so far.

    On the left we see the weekly average price of NFTs sold. Price were higher from October 2021 until April 2022 and now are at pretty low levels.

    Above we see weekly sales and cumulative stats. The sales have from July 2022 most likely due to the FIFA World Cup. Volume although was higher at three time periods way back, now volume is at pretty low levels compared to them.

    The number of sellers have remained pretty consistent throughout time with some ups and downs while buyers generally were lower and have now increased along with the sales.

    Above we see the top 10 NFTs sold by volume and by number of sales.

    We see that the highest paid NFT is at $13.5k while the second highest is at $7.3k.

    There are 3 NFTs that were sold 4 times, the rest of the list were all sold 3 times.

    Above we see there have been a total of 14.2k mints from 16.3k minters totally minting 336k tokens.

    Above we see weekly stats on mints. Weekly mints basically stopped on July 2021 and haven’t picked up ever since. Although minted tokens followed a similar trajectory since July this year they have picked up again especially on September.

    Above we see weekly stats on transfers. The weekly transfers and tokens transferred were high from Feb 2021 until July 2021 and then they had a strong decline. The senders had a similar trajectory while the receivers after July 2021 went down almost to 0.