Optimistic Bears (Redux)
Q9. Analyze Optimism during the month of July as markets were get turbulent, showing whatever metrics you care to unearth. You can choose any topic you’d like: How did the network perform? What about market performance? Were there significant inflows or outflows on bridges? Were there any notable patterns in user behavior?
Introduction
What is Optimism?
Optimism is a fast, stable, and scalable L2 blockchain built by Ethereum developers, for Ethereum developers. Built as a minimal extension to existing Ethereum software, Optimism's EVM-equivalent architecture scales your Ethereum apps without surprises. Optimism is a scaling solution for Ethereum that can support all of Ethereum's Dapps. Instead of running all computation and data on the Ethereum network, Optimism puts all transaction data on-chain and runs computation off-chain, increasing Ethereum's transactions per second and decreasing transaction fees.
What is OP Token?
Optimism (OP) is the native token of Optimism, OP has a total supply of 4.294 billion. The OP token gives holders participation rights in The Optimism Collective, a two-tier governance system composed of Token House and Citizens’ House. Citizens’ House will come live later in 2022. Token House, which is already active, governs technical decisions related to Optimism, such as software upgrades. The Citizens’ House governs public-goods funding decisions. In its early days, Optimism itself raised funds on Gitcoin, a major public-goods funding platform.

Methodology
In this bounty, We are going to analyze the Optimism network during July 2022 as markets were get turbulent,
In my opinion, We can analyze the cryptocurrency market situation by analyzing its top cryptocurrencies (BTC and ETH).
Whenever the BTC price fell off, we obviously see a similar decrease in cryptocurrency market cap and also Altcoins prices. Because the cryptocurrency market is highly correlated with bitcoin is to say that it doesn’t move up (or down) without BTC moving up (or down) as well. This is what correlation means: when one correlated variable moves, the other correlated variable moves with it.
But, in addition to BTC price, other on-chain data and also and stock prices are somewhat correlated together. Many of the factors that affect stock prices also affect cryptocurrency prices. Investors and traders treat cryptocurrency the same way they treat stocks, so prices tend to trend the same.
Moreover, I am going to check some “Health” related factors for the Optimism network during this time.
Based on the below charts which are showing BTC and ETH price (Market situation in my opinion) during July 2022 w.e can define the bearish time of markets (when the market get turbulent).
So, we can see two huge crash rallies during the month of July. The first one is between the 8th - 13th of July and the second bearish time is between the 20th - 26th of July.
So, I am going to refer to these 2 timespans in my descriptions to analyze the Optimism network during the month of July, especially during these 2 bearish timespans.
On the above data, we can see there were total 3.44M Unique Transactions on Optimism in July made by 195k Unique Users. The total generated fee by these transactions and users is 226 ETH (352k USD)
On the left chart, we can see the maximum and also average TPS of the Optimism network during the month of July.
As we see, the maximum number of TPS have achieved on13th July (on the last date of the first bearish period) with 409 TPS made.
Moreover, we can see another high spike on 27th July (when the market was about to recover its price after a second bearish period).
Moreover, totally, we can clearly see an increasing trend of Optimism Average TPS over time during July, especially during the last days of this month when the OP rally was going on.
On the left chart, we can see distribution of failed and successfull transactions during the July month for Optimism.
As we see more than 90% of all performed transactions were successfull which is a satisfying results and only less than 10% of transactions have lead to fail.
In the above charts, we can clearly see the price correlation between OP and ETH, BTC over time during July.
We can see OP correlation with ETH is way more than its correlation with BTC.
Moreover, the interesting this is that OP is well-controlling its price during the market bearish periods because we don’t see a huge price crash during these 2 timespans. Also, during the second bearish period, we can even see the increasing price of OP tokens over time despite the market situation which is amazing!
And on the last days of July, we can see as the BTC and ETH prices grew, the OP token price is also growing more and more and this shows the correlation between OP vs ETH and BTC, especially with the ETH token which has the most similar trend movements to each other.
On the left chart, we can see the daily number of transactions during July for Optimism.
As we see, the total positive trend is clearly visible on the chart, especially during the last days of July.
Moreover, we can see there are far more Successful transactions than Failed ones on all days, the failed and success rates of transactions have a correlation with the number of transactions.
Also, during the bearish periods, we can see almost a constant number of transactions and also a constant rate of successful and failed transactions on the chart which is satisfying and shows us how Optimism is managing the network performance during these bearish timespans.
On the left and above charts, we can see the correlation between number of Optimism transactions vs OP and BTC and ETH prices over time during July.
We can see there is quite a positive correlation between these metrics. As the number of Transactions growing up, the tokens’ prices also grow more and more.
Obviously, the most correlation for Optimism transactions count is with OP price.
the correlation between Optimism transactions count and BTC and ETH price is almost equal to each other.
During bearish periods, we can also see the constant number of transactions on Optimism and this shows that its users do not care much about the market situation when performing transactions on Optimism.
On the left chart, we can see the number of unique users that are performing transactions during July.
As we see, there is almost a constant number of users over time which has increased significantly after 27th July.
during the bearish periods, we can see almost a very light negative trend in the number of users interacting with Optimism transactions.
But, immediately after the stability or growth of the market, we can see high spikes in the number of Optimism users.
On the left chart, we can see the total daily generated fee (in ETHand USD) over time in July.
As we see, the most volume of fees was generated during the last days of July, the same time when OP price was growing more and more.
There is a sudden high spike of increasing transactions fee after 19th July.
during bearish periods, we can see a constant well-controlled generated fee for Optimism.
And on the left chart, we can see the cumulative number of transactions on Optimism during July month based on their status (failed or successful).
As we see, the increasing trend of these trend lines during last days of July is clearly visible on the chart.
NFT Activiy
Now, we are going to analyze the total stats of NFT sales on Optimism.
Btw, the only platform that the Optimism NFT sales table is supporting on Flipside is currently Quix (Former Quixotic, which is the top NFT marketplace on Optimism), So, the data below shows the analysis for this marketplace and we can expand it to the whole NFT ecosystem of Optimism.
Based on the above data, the total number of NFT sale transactions on Optimism during July is 15.07 Unique TXs. This number of sale transactions has generated more than 164.6k USD Volume.
The total number of unique NFT buyers on Optimism during July is 4150 and the number of sellers is 5370 unique wallets.
Moreover, there were a total of 106 NFT collections (including 10.06 tokens) that were traded during July on Optimism.
In the above chart, we can see the number and volume of NFT sales and also the correlation between OP price and the number and volume of NFT sales on Optimism during July.
We can see the increasing trend of NFT sales during July month, especially after 26th July which is the sharpest trend of increasing OP price and also the number of NFT sales achieved during this time.
Moreover, we can see there is almost a similar correlation between OP price and NFT sales on Optimism over time and it is clearly visible during the last days of July.
Also, we can see the impact of the first bearish market period, but for the second one, we can not see any impact on NFT sale volume.
On the left chart, we can see the growth rate of volumes and number of NFT sales transactions on Optimism.
As we see, the increasing slope trend is clearly visible after 26th July.
Also, the growth rate of number of sales is growing faster that their volume.
On the left chart, we can see the number of NFT sellers and buyers on Optimism during July.
We can see the total increasing trend of these numbers, especially after 27th July ( the same time when we had the increasing number of sales).
Moreover, during bearish periods, we can barely see a decreasing number of sellers and buyers on Optimism which means the NFT traders on Optimism don’t care very much about market situations
Bridge Activity
Now, I am going to analyze bridge transactions via the native Optimism bridge during July.
The contract address for bridging from Ethereum to Optimism is : 0x99c9fc46f92e8a1c0dec1b1747d010903e884be1
The contract address for bridging from Optimism to Ethereum is : 0x25ace71c97b33cc4729cf772ae268934f7ab5fa1
As we see, the total TVL of the Optimism native bridge was increasing well over time.
Also, during the first market bearish period, we can see also a decreasing trend of TVL on the Optimism bridge, but on the second bearish period, we can not only see any negative impact but also the TVL of the Optimism bridge is growing more, and more.
In the above charts, as it is obvious, we can see the most volume and number of bridges and bridges have happened from Ethereum to Optimism (L1 to L2). But despite the total volume, The average and median and also the maximum volume of bridges from Optimism to Ethereum is more than Ethereum to Optimism.
In addition, we can see most number of bridges from Ethereum to Optimism in the July had $1000 - $10000 volume but a huge share of bridges from Optimism to Ethereum (more than 52% of all bridges) were done with more than $10000 volume !
Now on the above charts, we can see the daily Optimism <=> Ethereum bridge activity over time in July.
Totally, there an obvious increasing trend in all charts over time that shows the increasing activity of bridges over time in July.
As it was obvious, the most number of bridges in all days were made from Ethereum to Optimism, and also the number of bridgers for this path is more than Optimism to Ethereum.
Also, we can see a significant increase in these numbers during the last days of July, especially after the 27th.
Moreover, we do not see a significant impact of the first market bearish period on the bridge’s activity. during the second bearish timespan not only there is no negative impact of this bearish period on the bridge activity but also the number and volume of bridges increased over this timespan.
During the first days of July, there was a huge significant volume of bridges from Optimism to Ethereum to the extent that the total volume of bridges on this path was more than Ethereum to Optimism till 25th July. But, after mid-July (~14th July), we can see increasing trend of bridges volume from Ethereum to Optimism over time till the end of July to the extent that the total volume of bridges on this path has overtaken the total volume of bridges on the opposite path after 25th July.
There are again some high spikes of bridges volume from Optimism to Ethereum during 26 - 30th July but their volume was not high as the first days of July.
In terms of average volume, we can see the average volume of bridges from Optimism to Ethereum in almost all days is way more than Ethereum to Optimism.
Swaps Activity
Now for this part, I am going to analyze transactions with their event_name is Swap, as well as the situation of DEXs on Optimism during July.
Based on above definiation, we can see there were total 1544874 Unique Swap Transactions during July that were made by 46801 Unique Wallets.
On the above charts, we can see the correlation between number of swaps and also swappers on Optimism and OP token price. as we see, there is quite a direct relation between these 2.
The number of swaps and swappers have increased dramatically during the last days of July (the same time when OP ecosystem has growth well according to the previous charts).
Moreover, there is not a negative impact of bearish market period on number Optimism swaps and swappers.
On the left chart, we can see the number of swap transactions on top Optimism DEXs during July.
We can see the highest number of swaps were made on Velodrome and Uniswap as the top leading Optimism DEXs.
Moreover, we can see a significant increase in swap transactions during the last days of July, especially after the 28th.
Also, the negative impact of the first bearish market period is visible in a number of swaps on these DEXs. but the second period did not make a negative impact on these numbers.
on the left, we can see the growth rate of number of swap transactions on Optimism DEXs which we can see Velodrome and Uniswap is leading all the way by far and have close competition over time.
And on the above charts, we can see that USDC and ETH are the most popular assets to bridge via Optimism native bridge during July.
ETH had the most number of bridges from Ethereum to Optimism but USDC was the top asset in terms of volume.
on the opposite path (Optimism to Ethereum), USDC had the most number and also volume of bridges during July.
And on the 2 above charts, we can see the Top 5 Popular swap pools on Optimism DEXs during July based on the number of swaps and also swappers.
As we see, Volatile OP/USDC (on Velodrome, in terms of number of swaps) and USDC/WETH (on Uniswap, in terms of number of swappers) were the top popular Pairs on Optimism DEXs during July
Summary and Conclusion
Based on the above analysis we have realized that the Optimism network's ability to maintain itself during the bearish periods of the total market is massively incredible.
- there were total of 3437525 Unique Transactions made in July.
- This number of transactions was made by 194706 Unique Users.
- The total generated fee by these transactions was $352k
- More than 90% of all performed transactions were successful which is a satisfying result and only less than 10% of transactions have resulted in a failure.
- The maximum number of TPS have achieved on 13 July (on the last date of first bearish period) with 409 TPS.
- OP token price correlation with ETH is way more than its correlation with BTC.
- There was a positive correlation between Optimism growth (especially its native token OP) and the number of NFT sales and also swaps during July.
- Optimism activity was less than both June and August on July 2022.
- The majority of actions on Optimism during July were Transfer-related.
- Destinations such as Optimistic Explorer NFT collection (especially in the last week of July) and swap protocols such as Uniswap & Velodrome and also protocols such as Hop & Perpetuals were the most popular destinations of Optimism transactions during July.
- The impact of the first bearish market period (8 to 13 July) was more than the impact of the second period (20 to 23 July) to the extent that we could barely see any impact of the second period on the Optimism growth. That’s why I have mentioned the perfect-controlling ability of this ecosystem during the bearish market periods.
- The bridge activity on Optimism during July was significantly increasing over time. The number of Ethereum to Optimism bridges and bridges was way more than Optimism to Ethereum but in terms of volume, the difference was lower because during the first days of July, there was the high volume of bridges from Optimism to Ethereum till mid-July but after a while, Ethereum to Optimism bridges volume increased dramatically and overtook the bridge volume of Optimism to Ethereum over time. But anyway, the average volume of bridges from Optimism to Ethereum was way higher than the average volume of bridges from Ethereum to Optimism.
- Also, the most number of bridgers on this month have totally performed 1 bridge transaction and the weight of bridgers from Optimism to Ethereum was more than Ethereum to Optimism bridgers.
- USDC and WETH were by far the top bridged assets via the Optimism bridge during July.
- Uniswap and Velodrome were by far the 2 most popular DEXs on Optimism during July and had a close competition together over time.
Discord: Ali3N#8546 Twitter: Alik_110 Tweet Link For This Dashboard:
With the upcoming release of Ethereum 2.0, investors are depositing an extremely large number of ETH to the Optimism smart contract with deposits spiking to 40,000 coins, which is an unseen number of coins deposited to Optimism in less than 90 days.
Besides the enormous spike in deposits, Optimism saw a spike in trading volume, which is a strong fundamental sign that might show that the current rally of OP token is filled with speculative trades and we might see a rapid drop in volume after the Ethereum update rolls out.
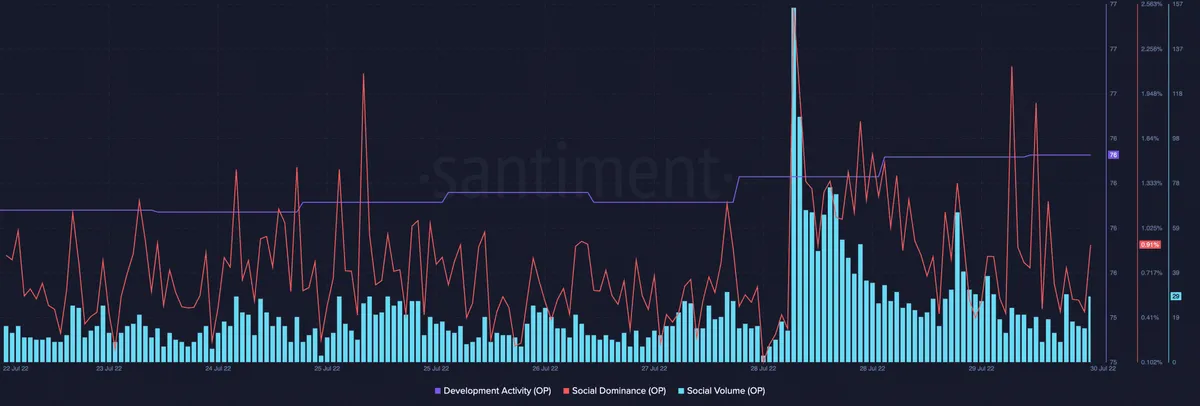
In the period under review, data from Santiment revealed that the token’s social dominance peaked on 28 July when the metric touched a high of 1.03%. This was, however, followed by a 32% decline causing the token’s social dominance to be pegged at 0.77% at press time. On a seven-day window, the token’s social dominance grew by 17%
OP’s social volume also touched a high of 1065 on 28 July. At 195 at press time, the metric registered an 81% decline within two days. On a seven-day window, this metric saw a 43% growth. Within the same period, the token’s developmental activity logged a minor growth of 0.37%.
Moreover, the protocol also saw significant ecosystem updates during recent weeks. For example, the L2 protocol launched its new Optimism onboarding flow for new and experienced cryptocurrency traders. Also, it launched its first Euro pegged stablecoin in the form of $agEUR.
On the left chart, we can see the different types of users’ daily activity during July on Optimism.
As we see, there is an exact correlation between new first-time and unique users on Optimism.
Moreover, we can see the increasing number of users in the last days of July, and its mainly because of Optimism ecosystem growth (or can be the reason behind that growth!)
According to the left charts, the average daily and also volume of bridges from Ethereum to Optimism was more than Optimism to Ethereum.
The difference between these 2 paths on the Volume’s chart is less than number of bridges and bridgers
On the left charts we can see most number of Optimism bridgers have totally done 1 bridge transaction during July (in both paths).
In terms of volume, we can see most number of bridgers on both paths have totally bridged $1000 - $10000 volume of assets using Optimism native bridge.
The share of users with more than $10000 bridge volume on Optimism to Ethereum is more than Ethereum to Optimism.
On the left chart, I have compared the activity on Optimism network on July vs Previous Month (June) and Next Month (August).
As we see, Optimism had less activity on July compared to the both August and June months and this can be mainly because of bearish market situation that affected Optimism.
On the left chart, we can see the majority of transactions on Optimism during July were Transfer-Related.
We can also see high share of Swap and Deposit and Withdrawal activities during this month on the Optimism network.
As a closer look (compared to the previous pie charts), we can see Optimistic Explorer NFT Collection (in terms of users count) and Perpetual Protocol (in terms of TX Count) were the most popular destinations of Optimism transactions during July.
On the next ranks, We can see majority of destinations were Swap protocols such as Uniswap, Velodrome, & 0x Exchange.
Popular Activities and Destinations of Optimism During July
And on the left chart, we can see the top 5 destinations of each week during July.
As we see, in most weeks Hop Protocol (mainly related to tokens) and Perpetual Protocol were the most popular destinations of Optimism transactions.
We can see significant increasing activity of Optimism users on the Optimistic Explorer (NFT collection) during last week of July.
Destinations Details:
> Perpetual protocol, formerly known as Strike, was created in 2019 inspired by emerging DeFi protocols such as Synthetix and Uniswap. The team sought to combine the merits of these protocols to create a decentralized perpetual contract trading protocol on Ethereum. The protocol is capable of supporting 10x leverage, short positions, and lower slippage compared to other AMMs thanks to its virtual AMM (vAMM) design. Unlike well known Automated Market Makers used for both token swaps and price discovery, the vAMM is solely used for price discovery to handle leverage and short positions. Similar to Uniswap, traders can trade with the vAMM without central authorities and is designed to be market neutral and fully collateralized. PERP is the protocol’s ERC-20 native token. PERP tokens allow community members to govern the protocol and stake their tokens for a fixed amount of time to the Staking Pool. In return, holders are rewarded with the staking incentive, which includes rewards in PERP and transaction fees.
Uniswap is top cryptocurrency decentralized exchange that uses a decentralized network protocol. Uniswap is also the name of the company that initially built the Uniswap protocol. The protocol facilitates automated transactions between cryptocurrency tokens on the Ethereum blockchain through the use of smart contracts.
Hop protocol is a mechanism for transferring tokens over a shared layer 1 network quickly and without trust. It provides customers with a two-pronged token bridge for Ethereum's layer 2 network. The solution aims to facilitate the rapid movement of a token between layer 2 and a scaling solution's governance token
Optimistic Explorer is An Optimism exclusive NFT collection for those adventurers on the digital frontier. Each NFT represents 1 of 5 buildings in the city of Optimism which corresponds to a selected interest. As of today, there is a total of 164678 NFTs minted, held by 140934 unique owners, and has a total market cap of $21,902.92.
Clipper is a new decentralized exchange (DEX) built for self-made traders, rather than hedge funds and whales. Clipper is designed to have the lowest per-transaction costs for small-to-medium-sized trades <$10K on the most popular cryptoassets.
Slingshot is a web3 trading platform where you can discover and trade 7,500+ crypto tokens at the best prices, and lightning fast speeds. Trade now on desktop, get on the list for mobile. Built for Web3. Connect wallet, start trading. Stay private and keep control over your assets.
Velodrome is an AMM designed as the central trading and liquidity marketplace on Optimism Network. It is the next evolution of the Solidly Exchange model introduced by Andrew Cronje.
Synthetix is a decentralized asset insurance protocol, and it allows users to mint, hold, and trade a wide range of derivatives – including commodities, fiat currencies, and even stocks. They can also do this for certain cryptocurrencies as well, the most popular being BTC.
Possible Reasons Behind OP Rally during July:
There are three key reasons for Optimism’s explosive gains. Analysts at Bloomberg believe that the rally witnessed in Ethereum and related assets signal confidence among investors on the transition to Proof-of-Stake.
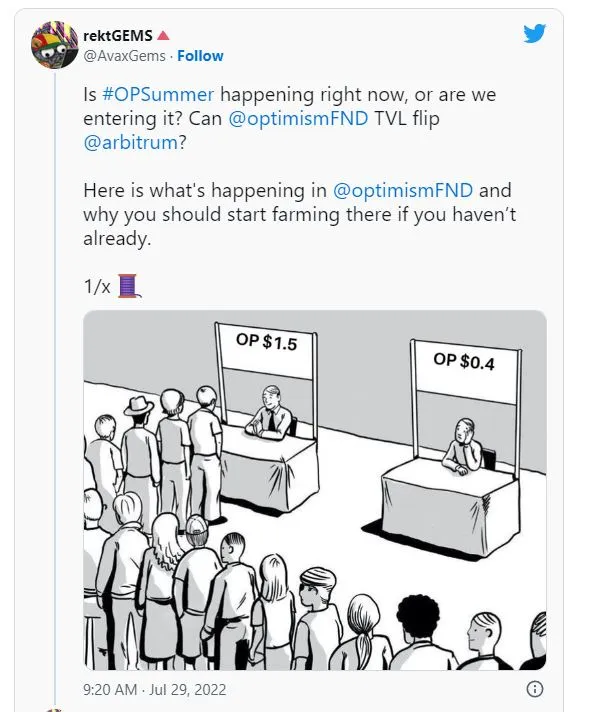
rektGEMS, a leading crypto analyst, evaluated the performance of projects on the Optimism network and Optimism’s explosive growth. The analyst noted that:
1. Optimism (OP) has outperformed Ethereum (ETH) in the last two weeks of July by over 100%.
2. Optimism’s TVL has almost doubled in July 2022 VelodromeFi, a central trading and liquidity marketplace, witnessed a 600% increase in its Total Value Locked. The project is now the number one decentralized exchange on Optimism. The analyst sheds light on OP Grant Proposal and identifies projects that could witness a rally in response to explosive growth in the Optimism ecosystem.
Moreover, Developers behind Optimism participated in the EthCC conference in Paris and offered insights on: Leveling up optimistic rollups through Cannon, next-generation fault-proof architecture. Optimism introduced Bedrock, the protocol’s next major upgrade. These developments chart the future of Optimism and the ecosystem’s growth over the next few months. Optimism revealed its plans for adopting Proto-Danksharding or EIP-4844 sustainably and efficiently. News of on-track development and community events fueled a bullish sentiment among investors.
Also In July 2022, Curve Finance submitted a proposal to increase the liquidity of the Optimism network, increasing the useability and adoption of the network while consequently affecting the OP token. The proposal saw one million OP tokens to be distributed over 20 weeks on the Curve pool, incentivizing liquidity providers to the protocol.