The Flippening Comparison
It finally happened. The great Flip everyone’s been waiting for — Optimism and Arbitrum have officially surpassed Ethereum in combined transaction volume. (What, you were expecting some other flippening?) Use this historic event to compare and contrast these two major L2 chains. Include metrics such as total and average transaction volume, average transaction size, active users, new users added, and anything else you find relevant to this comparison.
What is Arbitrum?
Arbitrum blockchain uses rollups to combine multiple transactions into one, lowering on-chain transaction costs and boosting scalability. It is a type of Layer 2 Ethereum scaling solution. The original Off-chain Labs team invented the Arbitrum protocol and developed Arbitrum L2 Rollups.
Arbitrum mainnet was officially launched on May 2022.
What is Optimism?
Optimism is a Layer 2 scaling solution for Ethereum that can support all of Ethereum's Dapps. Instead of running all computation and data on the Ethereum network, Optimism puts all transaction data on-chain and runs computation off-chain, increasing Ethereum's transactions per second and decreasing transaction fees.
Optimism mainnet officially launched on December 2021.
Optimistic Rollups
Optimistic rollups work by executing transactions on a layer-2 rollup chain while a node, called a sequencer, rolls up and subsequently posts transaction state data to layer-1. This method of processing transactions has the advantage of compressing the data posted to the Ethereum mainnet while also amortizing gas fees among transactions in each rollup batch.
Moreover, unlike side chains, rollup scaling solutions utilize the blockchain consensus mechanism of layer-one, allowing rollups to benefit from the security of large networks such as Ethereum. Also, as transaction throughput scales on layer-1, it does so too on the rollup layer. So, when combined with the ETH 2.0 merge, rollups have the potential to improve transaction throughput to ~100,000 TPS.
Optimistic vs. ZK Rollups
Unlike Optimistic rollups, which use a dispute-resolution process to secure transactions, ZK rollups utilize Zero-Knowledge mathematical proofs for transaction validation. Some key differences between them are as follows:
Optimistic rollups have a longer fund withdrawal period due to their security model.
Optimistic rollups are computationally less complex, resulting in layer-two nodes having lower hardware requirements.
Ethereum Virtual Machine (EVM) compatibility is much simpler on Optimistic rollups than on ZK rollups.
Currently, on both Optimism and Arbitrum, centralized sequencers must be trusted to post valid transaction data to layer-1. Theoretically, this is a security risk as it must be assumed there is at least one honest party between a sequencer and validator. However, sequencers are incentivized to act honestly, so in reality, the risk is minimal.
Optimistic rollups are the more popular of the two protocols with Optimism and Arbitrum controlling ~71% of layer-two market share.
Arbitrum vs. Optimism
While Arbitrum and Optimism are both classified as Optimistic rollups, they do have a few fundamental differences.
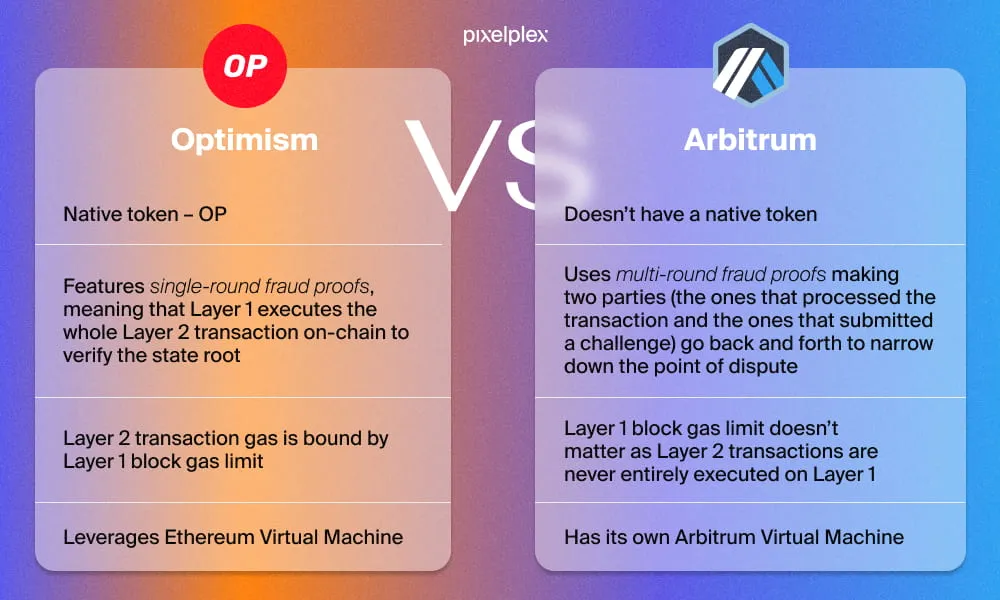
For one, they utilize a different dispute resolution process to validate transactions. Optimism uses single-round fraud proofs executed on layer-1, whereas Artibrum uses muli-round fraud proofs executed off-chain. Arbitrum’s multi-round fraud proofing is the more advanced of the two, with it being cheaper and more efficient than single-round proofing.
Also, while Optimism and Arbitrum are both EVM compatible, Optimism uses Ethereum’s EVM, whereas Arbitrum runs its own Arbitrum Virtual Machine (AVM). This results in Optimism having only a Solidity compiler, while Arbitrum supports all EVM compiled languages (Vyper, Yul, etc).
Optimism and Arbitrum Flip Ethereum in Transaction Volume
Ethereum layer-2 on-chain activity has been increasing to the extent that the leading two networks now process more transaction volume than mainnet Ethereum.
Based on the right chart, Layer-2 networks Arbitrum and Optimism have seen an increase in transactions over the past three months. Comparatively, aside from a few spikes, transactions on the Ethereum network have declined by around 33% since late October.
This has enabled the two L2s combined to flip Ethereum for this metric. According to the chart, Ethereum processed over 1.02 million transactions on Jan. 10, whereas Arbitrum and Optimism combined processed over 1.09 million transactions.
Additionally, Optimism has now surpassed Arbitrum in terms of daily transactions following a steady uptrend in activity since September.
Dashboard Introduction & Methodology
On the occasion of this “Flippening” (Flippening essentially refers to the potential moment when Ethereum will fare above Bitcoins and become the world's biggest cryptocurrency, but here, we mean Ethereum vs Optimism + Arbitrum!) In this dashboard, I am going to perform a deep comparison of Arbitrum vs Optimism in order to provide contrasts between these two major L2 chains. So, in this dashboard, I am going to:
- Compare The Number of Transactions, Active & New Users, Transactions Fees, Transactions Success Rate, Produced Blocks, and Transactions Volume on Arbitrum vs Optimism
- Analyze the Above Data Over Time.
- Analyze the Users activity on each chain.
- Extract the Top Popular Destinations of Transactions on Each Chain.
There are 2 provided parameters in this dashboard:
1- Time_Frame: You can use this parameter in order to set your desirable time frame for this analysis. For example, you can set the parameter to Last 30 Days in order to only show data for the past month. (Default: All Time)
2- Date_Trunc: This parameter only works on Over-Time Charts in order to set their time basis in Daily, Weekly or Monthly timespan. (Default: Monthly)
My descriptions of charts in this dashboard are for All_Time data on these chains.
One of the most challenging parts in this dashboard is calculating the $USD value of transactions (since there are no dim_price tables provided on Flipside’s Arbitrum and Optimism core tables). So, I have used .sushi.ez_swaps tables joining with .core.dim_contracts (for extracting the contract address and especially decimals of each token) in this part and then, calculated the value of swapped tokens with USDC & USDT stablecoins in order to extract the USD value of the swapped token (~price) in that time.
Since every transaction in EVM chains (that have $volume) generates a tx_hash in .core.ez_eth_transfers (for ETH) and .core.fact_token_transfers (for other tokens) tables, we can use their raw_amount column (amount_usd in ez_eth_transfers table which makes our work much easier) in order to analyze the transactions volume on these chains.
Also, Fees on these chains are generated in $ETH. So, I have provided both $ETH and $USD value of generated transaction fees in this analysis.
We should also consider this fact than Arbitrum main net was launched almost 6 months later than Optimism.
despite less age of Arbitrum chain, the Total number of transactions and also wallets who have made at least 1 transaction on this chain is more than Optimism.
The success rate of Arbitrum transactions is slightly more than Optimism (Optimism has an average success rate of 94.5% while Arbitrum has 97.18%).
Total Generated Transactions Fees on Optimism is more than Arbitrum. Also, The average and median transactions fees on Optimism is almost 3x more than Arbitrum! But obviously, both of these L2 chains has way lower transactions fees than Ethereum mainnet.
Despite higher number of transactions on Arbitrum, we can see the total volume of transactions on Optimism is more than Arbitrum and also the average and median volume of transactions on this chain is slighly more than Arbitrum transactions.
The majority of transactions on both chains are done with less than $10. Anyway, the share of transactions with $10 - $100 volume on Optimism is more than Artbirum. Also, the share of transactions with more than $100,000 volume on Optimism is more than Arbitrum.
In an average day, the number of transactions on Arbitrum is more than Optimism and also there more number of new users who are doing their first transactions on Arbitrum compared to the Optimism chain, So, The number of transactions per minute (TPM), Transactions per hour (TPH) and transactions per second (TPS) and also minutely, hourly and secondly active users on Arbitrum is more than Optimism
But, As we have seen before, the average daily volume of Optimism transactions is more than Arbitrum.
The speed of produed blocks on Arbitrum is also slightly more than Optimism. The main reason behind this higher speed of block producing can be because of the Arbitrum Nitro Upgrade in 31th August 2022.
> Arbitrum’s Nitro increases transaction throughput, reduces fees, and provides a better user experience for developers building applications.
Over-Time Charts
In this part, You can use Date_Trunc field above in order to set the charts’ time basis to your desirable timespan. (Default: Monthly)
On the above charts, we can obviously see the increasing and high growth rate of transactions, active and also new users on both chains as time goes on Over-time which is incredibly satisfying for these 2 major L2 chains. We can see Arbitrum was launched almost 6 months after Optimism but despite this lower age, we can see the higher number of Arbitrum transactions in almost every months over time and also the number of new first-time users on Arbitrum is more than Optimism in almost all days. Another interesting fact is that transactions fees on Arbitrum was almost more than Optimism till late-August 2022 (the Nitro upgrade) but after this date (started from September) we can significantly see the decreasing generated fees from transactions on Arbitrum which shows the successfull impact of Nitro upgrade on this chain. The success rate of transactions on both chains has almost an steady trend line over time. We can also see the growth rate of new first-time users on Arbitrum is more than Optimism and the difference between their growth rate is increasing as time goes on. Moreover, on the normalized %wise charts, we can see that since the launch of Arbitrum, this chain has almost absorbed Optimism transactions (especially in terms of number) as time goes on but transactions volume on Optimism is still more than Arbitrum transactions' volume in majority of days. The interesting fact is that since December 2022 and also till mid-January (analysis date), Optimism has now surpassed Arbitrum in terms of transactions following a steady uptrend in activity.
According to the above charts and as mentioned earlier, we can see that transactions' volume on Optimism is more than Arbitrum and this dominance is mainly because of Optimism good performance during the recent 2 months especially with that huge high spike on December 2022. The average volume of transactions on both chains are in a close competition together. in some days Optimism has higher average volume and in some days, Arbitrum has the lead. in both chains, especially after May (Terra Collapse), we can see the increasing share of low-volume transactions (less than $10 volume) over time especially on Arbitrum. on Optimism and especially during the recent months, we can see increasing share of transactions with $10 - $100 volume over time. Also, As we have seen before, the share of transactions with more than $100,000 volume on Optimism is slightly more than Arbitrum. Which means seems there are more "Whales" activity on Optimism compared to Arbitrum. The interesting thing is that Arbitrum had the least till December 2022 but after that huge high spike of Optimism transactions on this month, Optimism has now the lead in terms of transactions volume.
Blocks
$Volume
Transactions Destinations
Based on the above charts, in terms of number of transactions, DEX programs have the most share in Arbitrum chain while the share of Layer2 programs in Optimism is more than others.
In terms of number of interacted users, Layer2 programs have the dominance in both chains.
But in terms of volume, Decentralized Exchanges have the highest share in both chains. DEX’s dominance is way more than other program types in Optimism while on Arbitrum, we can see almost high share of Layer2 programs in terms of volume too.
During the recent months, we can see almost decreasing share of DEX programs in Optimism and on the other hand, increasing share of DAPPs and DeFi protocols on this chain.
We can also see that popularity of NFTs in both chains (especially Optimism) has decreased significantly over time.
Hop protocol is by far the most popular destination of transactions in both chains in terms of number of transactions and also interacted users. We can see some other famous destinations such as Uniswap, Rubicon (DEX), Quix (NFT marketplace), 1inch (DEX), 0x (DEX), AAVE (lending protocol) and etc among the top popular destinations of arbitrum and Optimism chains. In terms of volume, Rubicon is by far the most popular destination in Optimism and next ranks belong to AAVE, Gelato Network, 1inch and Uniswap. in Arbitrum, Uniswap is by far the most popular destination of transacstions and the next ranks belong to the Sushiwap (DEX), Hop Protocol and Across Protocol (Bridge Program). in Both chains, we can see the majority of Uniswap activity was during the first months of their launch and as time goes on, we can see other native swap protocols such as Velodrome and GMX which are absorbing Uniswap marketshare in these chains.
Summary and Conclusion
- Despite Optimism being elder than Arbitrum, the total number of done transactions on Arbitrum is more than Optimism and also the average transactions fees on Arbitrum is less than Optimism.
- The speed of transactions (TPH, TPM, TPS) in Arbitrum is more than Optimism.
- Arbitrum gas producing is less than Optimism (per block, per transaction, per $1M liquidity transfer, etc).
- But, the total volume of transactions and also the average volume of actions on Optimism is more than Arbitrum. There are also more transactions with higher volume on Optimism compared to the Arbitrum.
- The share of low-volume transactions (less than $10) on both chains has increased significantly over time especially after May Terra collapse. But as mentioned earlier, especially during the recent months, high-volume transactions and "Whales" activity is increasing more and more on Optimism.
- The number of produced blocks on these chains have almost the same speed and growth rate but we have seen that the number of executed transactions in a single block on Arbitrum have increased significantly after Nitro upgrade on 31th August.
- Optimism users are more active than Arbitrum users but the total paid fee on Transactions on Arbitrum chain is less than Optimism. The majority of users on both chain have done 2-10 transactions and spent 0.0001 - 0.001 ETH for transactions fees.
- Optimism most active users are also more active than Arbitrum most-active users.
- Layer2 programs (in terms of number of transactions and users) and Decentralized Exchanges (in terms of volume) are the most popular programs in Optimism and Arbitrum.
- Hop Protocol, Uniswap and Rubicon, AAVE, 0x and 1inch exchanges were some of the most popular programs used in Optimism and Arbitrum chain.
- The main reason of Optimism dominance in $volume is because of unusual activity in Rubcion exchange on December.
- We have seen decreasing dominance of Uniswap in both chains over time and on the other hand, some other native programs such as Velodrome and GMX protocols are experiencing growth over time.
-
In my opinion, both Optimism and Arbitrum each have advantages over the other without one of them being objectively better. I find Arbitrum’s team makes their marketing prowess quite clear through their ability to rapidly expand their social media presence and attract DApp developers to their chain. And in its current state, the rollup architecture of Arbitrum trumps that of Optimism in both security and longevity due to their superior fraud-proof mechanism and their proprietary VM.
On the other hand, Something I quite like about Optimism’s team is that they place a strong emphasis on both the decentralization of its protocol and its governance, more so than Arbitrum’s. It’s also currently cheaper to transact and swap tokens on Optimism, and their promising future plans may enable them to lead the charge in Optimistic rollup innovation which could eventually sway the market in their favor.
Discord: Ali3N#8546 Twitter: Alik_110 Email: Alik110.72@Gmail.com
According to the above charts, The number of produced blocks on these chains have almost the same speed and growth rate over time but on the right chart, we can see the number of executed transactions in a single block on Arbitrum have increased significantly after Nitro upgrade on 31th August.
Cons & Pros of Arbitrum vs Optimism
UNIQUE FEATURES OF ARBITRUM
- Arbitrum is considered to be the most EVM-compatible rollups at the bytecode level where-in any language that can compile to EVM can be used
- The team behind Arbitrum is working hard to minimize the barriers by producing comprehensive documentation for the developers
- The chain supports low fees compared to that of Ethereum using its extremely efficient roll-up technology. The chain is able to cut the fees into fractions while providing sufficient incentives for validators
- Arbitrum offers 100 times the throughput with only 2% of the fees
- As it is completely deentralized, the KYC requirement is eliminated
- A good ecosystem with powerful tools
UNIQUE FEATURES OF OPTIMISM
- Optimism can achieve 10x to 100x improvement in scalability
- It can reduce the fees with its rolling technology
- The chain is highly secured as it is built on top of Ethereum and the transactions are settled on Ethereum mainnet
- It offers enhanced user experience with new projects being benefited with lower fees & faster transactions
- EVM equivalence focuses on going one-step ahead.
- High secured data
Cons:
ARBITRUM:
- Does not have any native token.
- The Arbitrum gas fees are different from the Ethereum gas fees, serving a different purpose
Optimism:
- Long & costly withdrawals
- Potential incentive misalignment between network participants
- Underlying L1 censoring transactions
Users’ Activity on Chains
According to the above data, an average Optimism user is slightly more active than Arbitrum users since he/she have done more number of transactions than Arbitrum average user. But, the paid fee on transactions by Optimism users is significantly more than paid fee by Artbirum users (Optimism users have almost paid 2x more ETH for transactions fees compared to the Arbitrum users).
Also, we can see that majority of users on both chains have done 2-10 transactions. Also, we can see there are more number of Optimism users with high number of transactions compared to the Arbitrum users which is another proof to more activity of Optimism users.
Moreover, the majority of users on both chains have totally spent 0.0001 - 0.001 ETH for transactions. anyway, the share of users with high-paid volume for transactions in Optimism is more than Arbitrum which is another proof to less gas production of Arbitrum chain.
Based on the above charts, 0xfa7b9690ee257d444e61f2aa4002272e1ba3bfde is the most active Artbirum user with more than 49.1k done transactions on this chain while the wallet address 0x7107142636c85c549690b1aca12bdb8052d26ae6 is the most active Optimism users with more than 56.6k executed transactions on this chain.
On the other hand, the wallet address 0xe93685f3bba03016f02bd1828badd6195988d950 has spent the most ETH for Optimism transactions (more than 274.6 ETH) while the wallet address 0x710bda329b2a6224e4b44833de30f38e7f81d564 spent the most gas on Arbitrum (more than 190 ETH).
Totally, we can see top Optimism users have done more transactions than top most active Arbitrum users but the paid fees on transactions by top Arbitrum gas-spenders is less than Optimism users.
According to the left chart, the volume of generated gas per one Optimism block is more than Arbitrum.
Also on the right chart, I have calculated the average generated gas per 1 million $USD liquidity transfer within the chain. As we see, Optimism has by far generated more transactions fees in this case compared to the Arbitrum.
So, here is another proof that Arbitrum is performing better in controlling the transactions fees.