The table below shows the total reward distributed between the different addresses. On the other hand, the total number of addresses that received the reward is also given.
But some addresses have not received any reward. The table below shows the number of these addresses.
To show the distribution of rewards between different wallets, we have considered the following division:
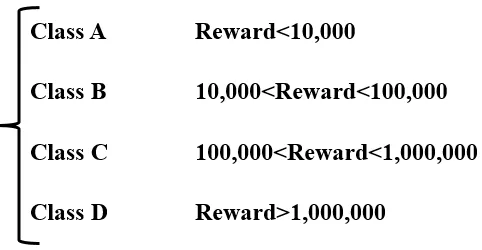
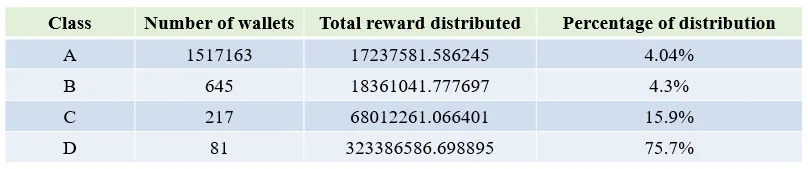
The wallets are placed in one of the classifications according to the amount of reward received. In the next step, the number of wallets that are placed in each class along with the total reward that is distributed in each class is shown in the chart below:
Class_D: Blue
Class_C: Orange
Class_B: Green
Class_A: Red
By viewing the chart above, the following results are obtained:
In the next step, the relationship between the wallet's engagement in the ecosystem and the amount of reward received is shown.Among the addresses are wallets that receive high rewards and fewer transactions than others, and vice versa. Therefore, it can not be said with certainty that the wallets that had more transactions necessarily received more rewards.
Finally, the chart below shows the relationship between the wallet size and the total reward received. It can be seen that wallets with more balance have received more rewards.