📃 Purposes of dashboard
In this dashboard, we look for signs that indicate a change in the trend in the crypto market. We want to know if the crypto winter is coming to an end or if we have to wait for more bear storms
❄️crypto winter
One of the riskiest financial markets is the cryptocurrency market, but after the price of $69,000 (BTC ATH price), the hopes of traders are more dim than ever because the price is several tens of thousands of dollars lower than its ATH. The downward of the cryptocurrency market has surprised and disappointed many people, but can we hope that after this heavy fall, there will be a big rise for Bitcoin like in previous years?
If the downward trend of the crypto market continues, it is called cryptocurrency winter. When the cryptocurrency market remains in the red for a long time and shows no signs of an upward trend, experts declare that crypto winter has begun, and this is one of the worst news for market holders. The first cryptocurrency winter began in late 2017 and lasted until mid-2019. During this period, the price of Bitcoin fell by 85%; In 2017, Bitcoin entered the $20,000 channel, and then early 2018, experienced a 70% price drop in just 50 days.
In 2019, with the beginning of tensions between China and the United States, as well as with the spread of the Covid-19 virus, which saw the beginning of a global economic crisis, the influx of huge capital into this market in a few months was able to turn the crypto winter into a pleasant spring in the middle of 2019. The whole world witnessed the terrible rise in the value of Bitcoin. In 2021, many experts predicted that the price of Bitcoin would stabilize at $68,000, but this possibility disappeared and at the end of November 2022 (November 21), Bitcoin reached the price of $15,479. That is, the price of Bitcoin decreased by about 77.5% compared to the ATH price. Many people consider the main reason for the beginning of the crypto winter to be the decision of the United States Federal Agency regarding the implementation of the financial contraction plan. In order to prevent further inflation, this organization decided to increase the bank interest rate, and its implementation caused those who had turned to the cryptocurrency market in this country in order to protect their assets against inflation, to leave the market, as well as many other investors. Potentially gave up on their decision to enter; On the other hand, since the beginning of Russia's attack on Ukraine, many news about the financial aid of other countries to Ukraine through cryptocurrencies have been published. Also, news was published that indicated the circumvention of the new global sanctions against Russia through these currencies, and the announcement of the ban on the use of cryptocurrencies by Russian IPs caused us to have more selling pressure.
⛄When does the crypto winter end?
1️⃣ Crypto winter usually lasts for more than a year and the overall trend in the long term remains bearish with no signs of an upswing.
2️⃣ The existence of any signs of climbing in the charts and (3️⃣)increasing the amount of purchases by users can be important signs for the end of this situation.
🧱 Strategy
To answer the question of whether the crypto winter is over or not, we analyze the following metrics:
1️⃣ BTC & ETH swap volume
2️⃣ BTC & ETH Price
3️⃣ BTC Transferred Volume to/from CEXs
4️⃣ Assessment of the status of Bitcoin miners
🔑 Methodology
The flipsidecrypto database was used for data extraction.
- The following tables are used to extract data related to the volume and number of BTC and ETH swaps:
ethereum.core.ez_dex_swapsarbitrum.sushi.ez_swapsavalanche.sushi.ez_swapsbsc.sushi.ez_swapsoptimism.sushi.ez_swapsoptimism.velodrome.ez_swapspolygon.sushi.ez_swaps
ethereum.core.dim_labels→ This table is used to get the addresses of different CEXs.ethereum.core.ez_token_transfers→ This table has been used to calculate the amount of assets transferred to exchanges.
Since the downtrend of the crypto market started from November 2021, so all charts are drawn from this month onwards.
🧐 Observation
From June 2022 onwards, the volume of BTC sales decreased. This point could be one of the signs of the end of crypto winter, provided that the volume of BTC purchases increases. But the process of buying BTC is also similar to the process of selling BTC. The results show that only in the months of September and December 2022, the volume of buying BTC was greater than the volume of selling it.

Examining the number of BTC traders also shows that the number of these addresses has been increasing from February 2022 to November 2022, while the number of these users has been decreasing in the last two months. On the other hand, the number of BTC buying and selling transactions has also decreased in the last two months.

The interesting thing to note here is that since the beginning of November 2021, in all months, the volume of ETH purchases has exceeded the volume of ETH sales. Another thing to note in the chart is that unlike BTC where there are more buyers than sellers in almost most months, in the case of ETH the number of sellers is more than the number of buyers.
🧐 Observation
Examining the BTC price chart shows that during the upward period, the average daily price was with a 200-day moving average almost on most days. On January 13, after a very long time, the average price broke above the 200-day moving average. If the price can stabilize above the MA200, it can be one of the signs of the end of crypto winter and the beginning of a pleasant spring. Examining the 50-day moving average shows that on most days of the bull market, the daily average BTC price is above the MA50, and in the bearish periods, the price has occasionally penetrated above the MA50, but has not been able to stabilize above it. In the last few days, the average daily price of BTC managed to penetrate above the MA50. As mentioned, in the past, the price of BTC managed to break above the MA50 several times, but quickly returned below it. It remains to be seen if the daily average price of BTC can stabilize above MA50 this time! Similar to the MA50, the MA30 indicator has acted as a support in the upward periods and as a resistance in the downward periods. Examining the MA200 on the ETH price chart shows that the average daily price has touched the MA200 several times in the past, but failed to penetrate above it. After the price of ETH collided with this indicator several times, in the last few days the price was able to cross the MA200 resistance. The stabilization of the high price of this indicator can be one of the signs of the end of crypto winter.

🧐 Observation
The daily price changes of BTC and ETH have been trending down. In bullish periods, price changes increase sharply. Another point is that usually before the beginning of the upward market trend, the price of BTC stays in a certain range for a long time and the price changes reach the lowest value. Currently, the daily price changes of BTC and ETH are similar to the second half of 2020 and before the start of the bullish trend.

🧐 Observations
Since June 2022, the volume of depositing and withdrawing assets from CEXs has been decreasing. In January, the lowest amount of BTC was deposited or withdrawn from CEXs. These are the lowest BTC transfers with CEXs since the start of crypto winter. On the other hand, in the last two months, the volume of BTC deposits to CEXs was about 65K more than the volume of BTC withdrawals from CEXs. In bullish periods, the volume of BTC withdrawals from CEXs increases. Currently, we do not see such a trend! 😥
When the volume of stablecoins deposited in CEXs increases, users are looking to buy more cryptocurrencies. This can be one of the signs of the beginning of an upward trend in the market. In the last 3 months, the volume of stablecoins withdrawn from CEXs was about 8.2B USD more than the volume of deposits to CEXs. \n This shows that users still don't have much desire to buy cryptocurrencies and prefer to wait a little longer until BTC reaches lower prices to buy their desired currencies at lower prices. ⏳

☔ Conclusion
In this dashboard, by examining some metrics, we were looking for a trend change in the market that would be a sign of the end of crypto winter. In the first step, we examined the volume of buying and selling BTC and ETH, the results show that in most months The volume of selling BTC has been higher than the volume of buying it, and the general trend of BTC swaps in various DEXs has been downward. As for ETH, its trading volume has been on a downward trend since the beginning of the crypto winter. Therefore, there was no sign of the end of the trend change in this part. In the next step, we evaluated the price chart of BTC and ETH. There are signs of a trend change in the price chart, but these signs are not definitive and we should wait a little to see if, for example, the daily average price of BTC can stabilize above the 200-day moving average! In the next part, we analyzed the volume of transfers of BTC and stablecoins with the CEXs, the results show that in the past months, the volume of stablecoins leaving the CEXs was more than the volume entering the CEXs. Also, the volume of BTC entering the CEXs has been higher than the volume of its exit. Therefore, it can be said that the crypto winter may continue a little longer. After examining all the above parameters, one of the promising indicators of the market in the last few weeks was the record setting of Bitcoin's Hash rate, which can be a bullish signal for the market and the end of crypto winter.It should be noted that the crypto market is strongly influenced by external factors, although this is in contradiction with the nature of cryptocurrencies,
So once again we have to wait and see what the groundhog tells us about the market trend ahead!

Analyst: Emanoel
***Twitter: ***
Discord: Eman#9698
Special thanks to the Flipsidecrypto & Metricsdao🧡


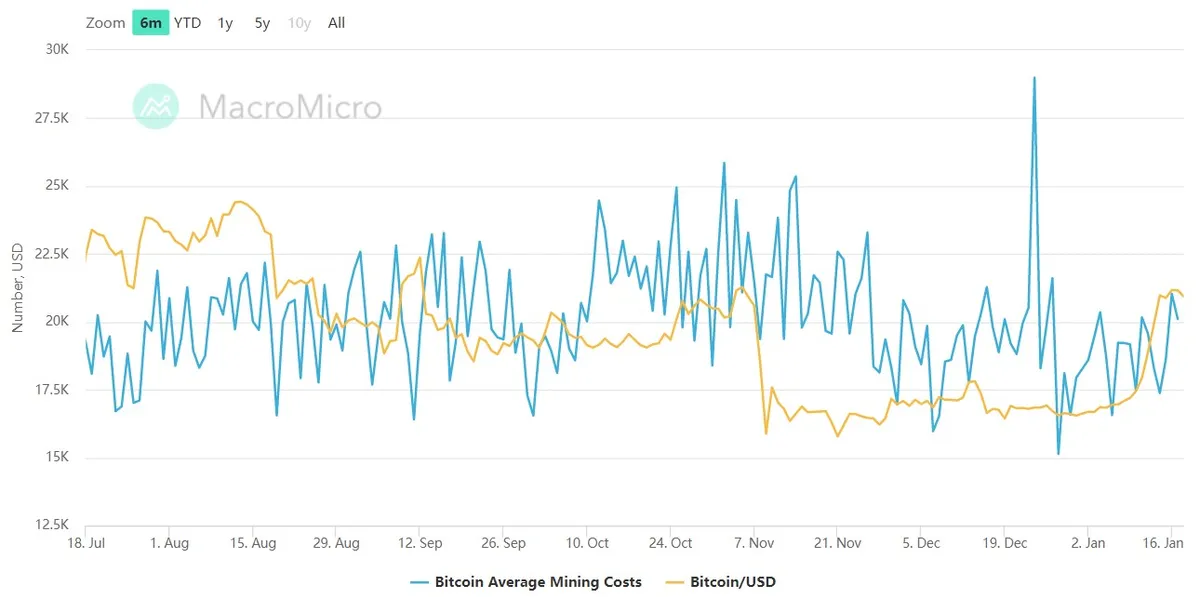
With the increase in the price of Bitcoin in January, for the first time in more than 3 months, the price of Bitcoin reached above the average cost of mining.
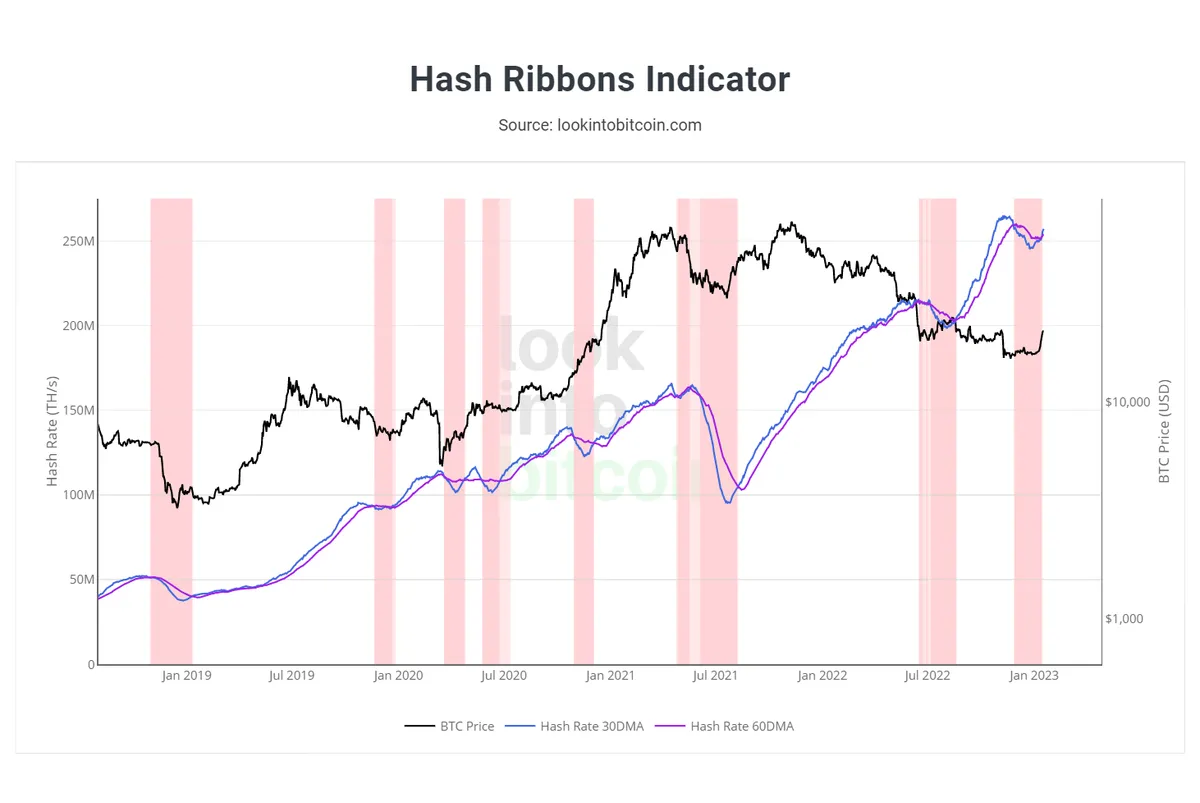
Also, one of the interesting events of recent days was the re-recording of Bitcoin's Hash rate. This has caused one of the most important indicators of the market situation, namely the Hash ribbon, to issue a bullish signal. As can be seen in the chart below, the 30-day moving average of Hash rate (blue curve) has once again reached above the 60-day moving average of Hash rate (purple curve), and the Hash ribbon that Bitcoin has been on for the last 6 weeks has come to an end. As can be seen in the chart below, Hash ribbon completions have historically been a very bullish signal in the Bitcoin market, and we have experienced a significant bull market following the completion of each.😍😍😍😍