Velodrome Health
Introduction
Velodrome Finance, at its core, is a solution for protocols on Optimism to properly incentivize liquidity for their own use cases.
Building on top of the groundwork laid out by Solidly, the team has addressed that first iteration's core issues to realize its full potential.
In this analysis we are going to answer the question "How healthy is this project?"
Considering that TVL is obtained through the formula of deposit minus withdraw, in this chart we examine the daily changes of deposit and withdrawal values in Velodrome. The graph is displayed as a bar, which shows the blue color of deposit amounts and the orange color of withdrawal amounts. According to the graph, you can see that in the initial days when the project started, the deposit and withdrawal values are at a low level, but on July 7th, as we said in the first graph, the TVL values have started to grow, which indicates the increase in the daily deposit amounts. be And the deposit amounts were higher than the withdraw amounts until August 3, but since August 4, due to the hacking of the Velodrome project (Refrence), the withdrawal amounts have increased greatly and caused a decrease in TVL. On the 5th of August, the deposit and withdrawal amounts were very low, and in the following days, the withdrawal amounts were more than the deposit. The largest deposit amount is nearly 16 million dollars and the largest daily withdrawal amount is 17.5 million dollars.
For the second criterion in this chart, we have examined the daily changes of the swap and Liquidity pool in Velodrome. In the line chart above, the blue color shows the number of daily swap transactions and the orange color shows the number of daily Liquidity pool transactions. The number of Liquidity pool transactions has been almost constant with little fluctuations since the beginning. But the number of daily swap transactions has changed a lot. Similar to the previous graphs, since the beginning of this protocol until July 7 and 8, there have been slight fluctuations, but since this date, the number of daily swaps has increased, and as a result, it reached the highest point of the graph on July 20, on this day, the number of 71 Thousands of swap transactions have been registered. From July 28 to August 1, the number of swap transactions decreased and reached 33 thousand transactions. From August 1st to August 3rd, these transactions increased up to 46,000 swap transactions per day, but on August 4th, the number of swap transactions decreased greatly, and on August 5th, it reached the lowest amount of daily swaps, i.e., 1702 transactions, the reason being as follows. What was said above was the hacking of the Velodrome protocol. From August 5 to August 17, there were fluctuations, and the highest number of daily swap transactions was 30,000 transactions.
In this chart, you can see the number of users who did swap or Liquidity pool on a daily basis. The blue color in the line chart shows the Liquidity pool and the orange color shows the swap.
In general, the number of users who swapped is more than the users who did Liquidity pool. On July 28th, the number of users who swapped was 3810 users, and until that day it was the highest number of users, but on August 4th and the next day, the number of users who swapped reached 255 users. After August 5, the number of users who swapped increased and there were fluctuations in this number, but on August 16, the number of users who swapped reached the highest number of users. 4185 users made a swap on August 16, and the number of users reached 1776 the next day. The number of users who made liquidity in the pools did not fluctuate as much as the users who swapped, but after the small growth that it had from the beginning of the Velodrome project until August 3, due to the hacking of the protocol on August 4 and 5, the number of users fell to 65 users. did On August 11, the number of users who created liquidity was 941 users, which is the highest ceiling.
There are 141 pools on Velodrome finance. The number of used pools has been increasing before August 4th, but since this day due to hacking, this number has suddenly decreased, so that it decreased to 49 pools on August 5th.
- The most used pools were on August 3 and 12, with 78 pools used.
- The lowest pool usage was on June 15, the start date of the project, with 30 pools used.
Among of these pools, people have interacted more with some of them. vAMM-OP/USDC , vAMM-VELO/USDC, and vAMM-VELO/USDC are top 3 pools (by volume).
Conclusion
Based on all the criteria used: In general and from the point of view of users, this platform is currently not reliable. The reason for this can be pointed to the hacking incident. Since August 4th, the locked property rate has been declining. The number of transactions has also been affected and decreased. According to the data, this platform has been able to attract good capital in a short period of time, but after being hacked, this process has slowed down. Based on the potential that this platform has shown, it can regain the trust of users in the future and over time.
\
Methodology
In order to evaluate the performance of a platform, measurable criteria should be considered and analysis based on that. In this dashboard, three criteria have been selected for analysis:
-
TVL: Using this measure, the amount of assets locked in the platform is checked. If the change trend of this criterion is upward, then it can be concluded that the public acceptance of this platform has increased and it shows the health of that platform.
The following tables were used to analyze the data of this section:
optimism.velodrome.ez_lp_actions -
Transaction trend: Another criterion that can be used to check the performance of a platform is the number and rate of transactions in its different parts (Swap, Liquidity,...). As mentioned, the level of health of a platform has a direct relationship with the level of users' use of that platform. The following tables are used for the analytical review of this section:
optimism.velodrome.ez_lp_actions | optimism.velodrome.ez_swaps -
Active Pools: another criterion for evaluating this platform is based on its liquidity pools. In a platform, the higher the number of active liquidity pools, it means that the platform has performed satisfactorily and this can be considered as the health of the platform. It can be said that this platform has been developed with the increase in the number of pools.
The following tables are used to evaluate the analysis of this section:
optimism.velodrome.ez_swaps -
Unlock data: The final criterion for checking is based on Unlock time for users. The amount of $Velo that is released over time can show a perspective of user interest. The larger the amount of tokens, the greater the amount of money entered, and it means that the performance of the platform has been adequate. The next part to be considered is Unlock time.
The larger the amount of tokens under the authority of the platform for a longer period of time, it means that users have more trust in this platform. As the assets available to the platform increase, there will be a more secure and healthy performance.
The following tables are used to evaluate the analysis of this section:
optimism.velodrome.ez_velo_locks
Regarding the unlock time, based on the diagram, we can say: Some users have chosen short periods of weeks and months. The reason for this may be because of the risk aversion of users due to the newness of this project. With the end of the year and the beginning of the new year, there may be drastic changes in the crypto market as in previous years. For this reason, users with an average level of risk will be active on this platform until the end of December. But there are also users who have high risk power and have chosen a period of several years. In general, the users have become two categories, those who have not chosen a long time for release due to the leading risks, and the second category are those who have special trust in this platform. In terms of volume, short-term users have more tokens. This issue can be caused by hacking the platform and creating a lack of trust in them.
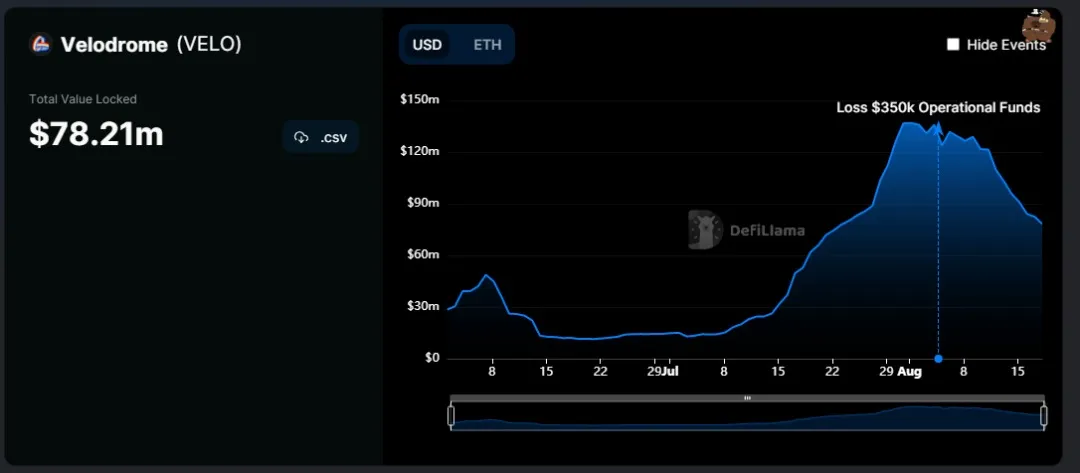
In the chart above, you can see the daily changes of TVL at the Velodrome. This chart shows from June 15, 2022 to August 17, 2022. The Y-axis in this chart represents TVL, which is in dollars. From June 15th, which is the start date of this protocol, to July 7th, there has been almost a constant trend, and TVL has had little fluctuations. From July 8th, TVL values started to grow and grew very well almost until August 3rd, and in this short period of time, the Velodrome protocol grew well. But as you can see, on August 4th, TVL will decrease daily, which is the reason for the hacking of the Velodrome protocol. The daily TVL value maintained its downward trend until August 15. And on the 16th and 17th of August, it remained almost constant. The highest daily TVL value is 108.1799M, which corresponds to August 1st.