


NFT MARKETPLACES: USER CROSS-OVER IN THE LAST 30 DAYS
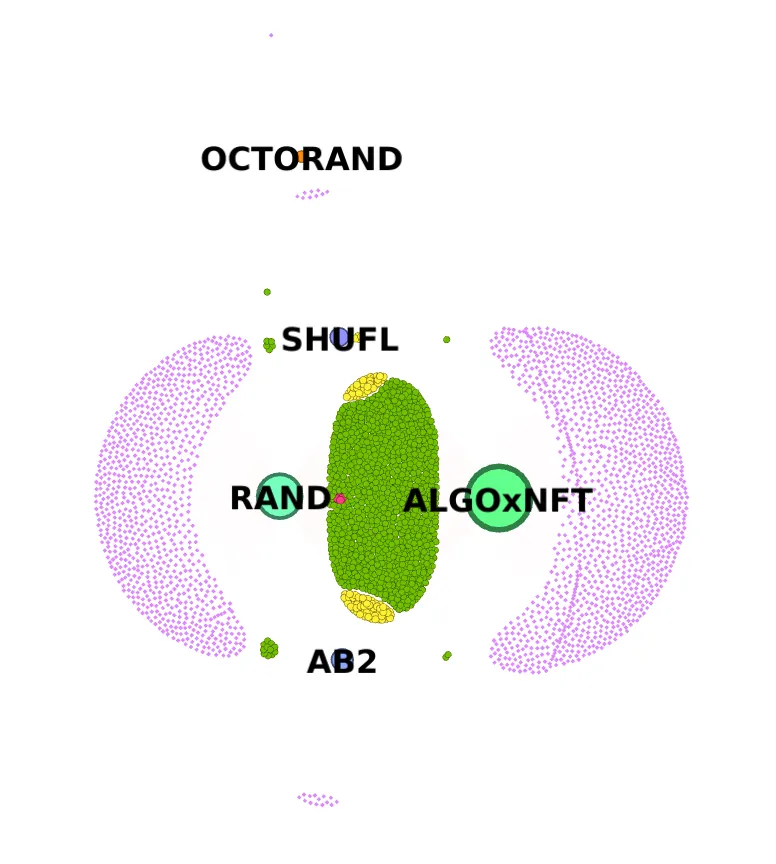
Ever wondered how the user cross-over between NFT Marketplaces ‘looks’ like? Below you can see a grapical representation of the 5 NFT Marketplaces analysed (nodes with label) and the purchasers, coloured according to the following legend:
- Purple: address who bought only in 1 marketplace
- Green: addres who bought in 2 different marketplaces
- Yellow: addres who bought in 3 different marketplaces
- Red: addres who bought in 4 different marketplaces
Most users operate either on RAND, on ALGOxNFT or on both, with some small communities transacting in 3 different Marketplaces (yellow nodes). The yellow communities in the middle cloud represent users who bought in RAND-ALGOxNFT-SHUFL and RAND-ALGOxNFT-AB2 and are bigger that the purple communitites on the edges of the graph (users who bought only in SHUFL, AB2 or OCTORAND). That means it is more likely that an active NFT trader operating in the leading marketplaces goes fishing in the niche marketplaces that a user onboarding through these niche marketplaces.
METHODOLOGY
All NFT Sales data was queried through the new algorand.nft.ez_nft_sales tables. A CTE was created listing the nft sales, with a time constraint dependant on a variable representing the last n days which should be analysed. This constrain also considers all data from the previous day to the current one to prevent missing data from the delay due to data backfilling.
I also noticed that some collection names were missing from the tables. To solve this, I created some string logic allowing me to take the name from the nft asset name without the id. This was integrated in the main CTE.
Several queries aggregated then the different metrics.
The network graph was created by extracting the nft sales data of the past 30 days getting the nft_marketplace as the source and the purchaser as the target. The resulting table is extracted as .CSV file and uploaded in the open-source Gephi for network visualization.