What is going through the Axelar-Osmosis Bridge?
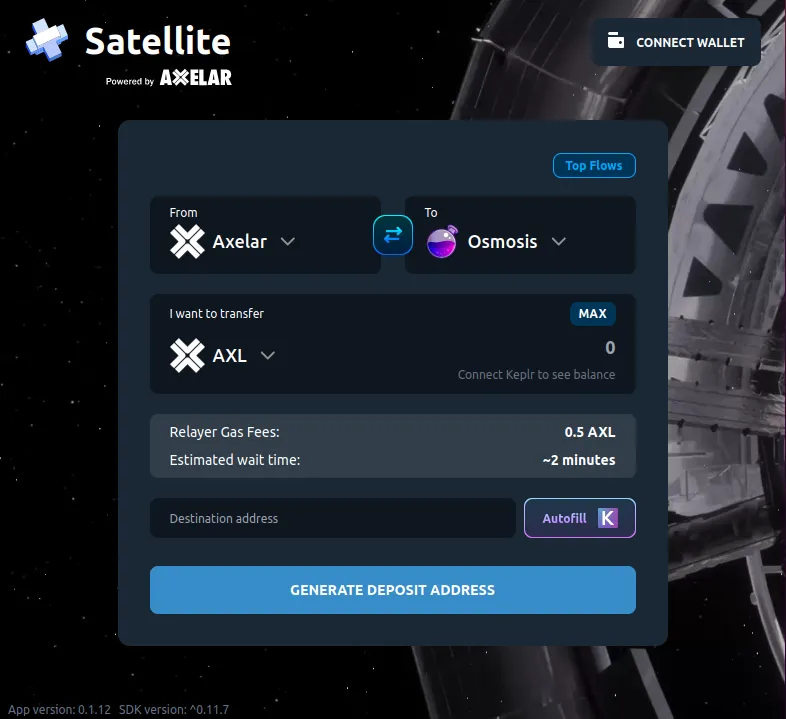
Satellite is the Axelar Network bridge allowing transfers of Axelar wrapped tokens between the supported chains. These include both Ethereum Virtual Machine (EVM) chains (Ethereum, Polygon, Avalanche, Binance Smart Chain, Fantom and Moonbeam) as well as Cosmos ecosystem chains like Cosmoshub, Osmosis, Injective and Kujira. The latter are connected with the IBC protocol, building communication channels between Axelar and the Cosmos blockchains. An extensive list of the existing channels can be found here.
This dashboard will analyse the liquidity coming into Osmosis, allegedly the main liquidity hub of the Cosmos Network, from the Satelite bridge. Let’s cross the Axelar-Osmosis bridge!
Liquidity to Osmosis in the last 30 days
First, let’s analyse the token inflows to Osmosis both as USD volume and number of transactions for the past 30 days.
The most bridged asset is AXL token followed by wrapped USDC. These two assets account for 90% of the USD volume and 80% of the total transactions in the last 90 days. A total of 1.5M USD AXL token and 0.75M USD USDC volumes were bridged in this time.
Wrapped Ethereum and Bitcoin come in 3rd and 4th respectively, with a higher percentage in total transactions compared to USD volume. The activity on these 2 assets concentrates in the last two weeks, therefore an additional analysis for the past 7 days has been done to follow the short time trend.
Other assets are not significant in either metric, so they will not be considered down the line.
Liquidity to Osmosis in the last 7 days
The trend in the last 7 days shows that AXL token ilost the dominant position in USD volume to USDC token (180k compared to 188k). Also wETH and wBTC are having higher volumes, still far from AXL and USDC.
But number of transactions show that AXL is dominating with 54% of the total transactions, with wETH closing the gap to USDC and wBTC following behind.
That means that USDC transfers have slighty more volume as AXL trasnfers with one third of transactions.
A total of 1050 unique osmo… addresses received a transfer via Axelar Satellite in the last 30 days, totalling 4550 transactions (over 4 transactions per user in average). In total, 2.5M USD were provided as liquidity to the Osmosis Network, 98% in either AXL, USDC or wETH.
In terms of distribution, 67.5% of address only transferred once and an additional 28% transferred up to 10 times. But accounting for total volume in USD, the addresses with over 10 transactions were responsible for 58% of the total volume.
Once an address received a transfer, the most popular events are swaps and IBC transfers out of Osmosis. These two events average between 70% and 88% of the daily transactions and between 55% and 75% of the daily unique users, amongst the addresse which transferred via Axelar Satelite in the first place. The third most popular event are Liquidity Provider Actions.
Key insights
-
A total of 1050 addresses provided a combined 2.5M USD liquidity to Osmosis via the Axelar Satellite in the past month, with a total of 4550 transactions. Most popular tokens transferred were:
- AXL 1.5M USD
- USDC 0.75M USD
- wETH 200k USD
- wBTC 43k USD
-
The short term trend indicates that USDC is become as popular as AXL, both tokens having a 180k USD volume in the past 7 days.
\
-
Almost 70% of the addresses only make one transfer via Satellite while over 55% of the USD volume comes from superusers with more than 20 transactions
-
In the past 30 days, the most popular actions taken by users after a transfer are swaps (47k swaps), IBC transfers out of Osmosis (19k) and LP actions (7.4k)
Methodology
This analysis was built with several queries using modifications of the same CTEs.
To obtain the list of transactions between Axelar and Osmosis, the axelar.core.fact_transfers table was queried with two separate time constraints for the past 30 and 7 days, transfer_type = 'IBC_TRANSFER_OUT' and receiver ilike 'osmo%' to select the transfers to Osmosis. Only successful transactions were select with
The asset prices were obtained from the ethereum.core.fact_hourly_token_prices table using the asset addresses from the Axelar Documentation. Additionally, the crosschain.core.fact_hourly_prices table was also queried to obtain the prices of uosmo and dot-planck since these were not provided as Ethereum addresses in the documentation.
By joining these two tables and aggregating by asset, date or address the volume in USD, number of transactions and users distribution could be calculated within the different query documents.
To find out what type of transactions were made after transfering to Osmosis, a method based in this dashboard by @Pinehearst was used. Using the Osmosis Core Fact tables (osmosis.core.fact_superfluid_staking, osmosis.core.fact_staking, osmosis.core.fact_staking_rewards, osmosis.core.fact_swaps, osmosis.core.fact_liquidity_provider_actions, osmosis.core.fact_governance_votes and osmosis.core.fact_transfers), tx_id were labelled by event type. The transactions from osmosis.core.fact_transactions which did not receive a label from the previous tables were labelled as ‘Other'. This lead to a single CTE of all transactions in the selected timefram in the Osmosis network.
The next step was to left join this transactions CTE with a CTE containing a list of addresses which received a bridge from Axelar with the timestamp for the first transfer. By setting the difference between each Osmosis transaction timestamp and the first Axelar transfer timestamp as bigger than 0, I was able to consider only the transactions for each address that happended AFTER the first Axelar transfer. Aggreagting by date and event allowed me to obtain total transactions and daily users over time in absolute value and normalized.