Bots and success rate
Compare the success rate of transactions executed by bots in the past 60 days with average users' transactions in the same time period. Is there any difference and any trends identifiable?
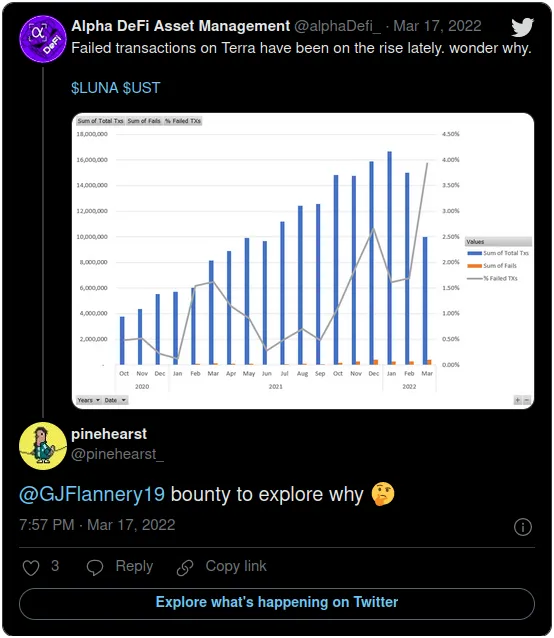
It all started with a retweet...
What a simple retweet can unleash in a CEA community! Following the tweet above, a Terra bounty was created and some incredible insights were published.
This dashboard will be a revisit of the analysis from Transaction Failure where the Terra's failure rate since October 2021 was analysed. This time, we will look at it with a more positive vibe, analysing the success rate since January 2022 and will look for trends in the last 60 days.
Methodology
First, the definition of bot will be revisited. I will now define 3 types of addresses (human, cyborg and bot) based on the max number of transactions executed on a certain day (up to 10, between 10 and 25, more than 25 tx/day respectively).
Then, the successful and total transactions as well as the transaction success rate (TSR) in percentage will be calculated for the period analysed for each type.
Additionally, trends will be investigated taking a look at correlation between volume and TSR, Tx type and gas stats.
Results
Results are divided in 3 sections corresponding to the methodology described.
1. Address type as a function of daily txs
Figure 1 shows the user percentage by address type as a function of the max transactions in a day. Human users with a max txs count of 10 are 94.5% of the unique users that sent a transaction in the last 60 days, Cyborgs account for an extra 4.3% with up to 25 tx and bots account for 1.1%. The max number of transactions in a day is 11.3k.
2. Transaction Success Rate (TSR) and Network volume
Figure 2. shows the TSR for all three types. Human TSR is higher for the first part of the time frame, with the lowest percentage for Cyborgs (92.6%) and Bots (94.4%. Then all three tend to stabilize between 97% and 99%, with an exception on April 11th for bots at 96%.
Figures 4. and 5. show the total transactions per type, both normalized and in absolute value. Distribution is relatively stable, with Bot txs accounting for around 85% of total txs with Human txs around 8.5% and Cyborgs 6.5%. Taking a closer look and the total amount of txs, on April 11th an ATH for the time period occurs, with almost 1.2M txs.
Is the Success Rate correlated with Network volume? Let's take a closer look!
3. Trend analysis
3.1 Correlation between total txs and TSR
Figures 6., 7. and 8. show the correlation between Total txs and TSR for each type. The negative trend is clear for the Bots, the higher the total txs per day, the lower the TSR. For Cyborgs and Humans, the correlation is unclear. High txs days have comparable TSR than low txs days.
It seems that the Cyborg behaviour and transactions numbers is more similar to Human than to Bot. Them may have some soul left in them after all!
From now on, the analysis will consider Cyborgs and Humans in the same group, renaming them to Carbon-based.
Figure 3. shows the updated TSR for Carbon-based (Humans and Cyborgs) and for Bots. Having different behaviours signalises different causes for the success rate decline in both cases. Next section will take a deeper look at the failure causes.
Figure 9 shows the msg_type of the failed transactions over time. The wasm/MsgExecute is the dominant one. In Figures 10. and 11. the top 3 msg_type distribution is shown for each address type. The trend is continued, but with some indications that the dominance of wasm/MsgExecute for CARBON-BASED wallets is less.
Conclusions
Addresses which at least one day in the period analysed executed more than 25 transactions in a day are defined as bots. These addresses account for 1.1% of all addresses and are responsible for around 85% of all transactions. Their tx success rate is negatively correlated with the amount of transactions executed, so probably it is linked with network congestion. Their TSR is more volatile than their carbon-based counterparts (with less than 25 txs/day. Max TSR for bots is 99.2% and min is 94.4%, 98.9% and 95.5% for their counterparts.