Active Wallets on Terra
Define "Active Wallets" on Terra. Based on your definition, display the active wallets by day, month, and Year-To-Date in 2022.
Introduction
Here is my Terralytics dashboard showing network stats such as active wallets daily, weekly, and monthly since inception.
That's it, I'm done...
Just kidding... (:
Let's look at the same stats for just 365 days (as of 2021-05-01) back, instead of since inception...
What we see is a continuous upwards trend, which is as expected, ever since protocols such as Astroport launched as well as others, volume sky-rocketed and a lot of people wanted to get in the network. What can be seen on the last day, could be incomplete data. For this reason, we should look at the weekly timeframe, where things are a bit more "smoothed out".
What we see here is this upwards trend and the big spike around the end of September, the beginning of October coincides with the news that Astroport was about to launch. In this timeframe things are much more "smoothed out" and the trend is much clearer. The weekly unique active wallet growth since last year has grown from ~20k to ~140k which is a 7x increase!!
The monthly unique active wallet growth since last year has grown from ~40k to ~350k which is an 8.75x increase!!! In this case, things are significantly more "smoothed out" and one can easily see a clear trend, with some (potential) slowdown in growth in the past month.
More Metrics
If this is not enough and you crave more metrics, as the above metrics do not tell the full story, you could have a look at my dashboard, which is created using Flipside, and more specifically velocity data!!!
There, you can find more network level metrics as well as bridging out of Terra and to what denoms, both to IBC and non-ibc chains.
Here's a sneak peak...
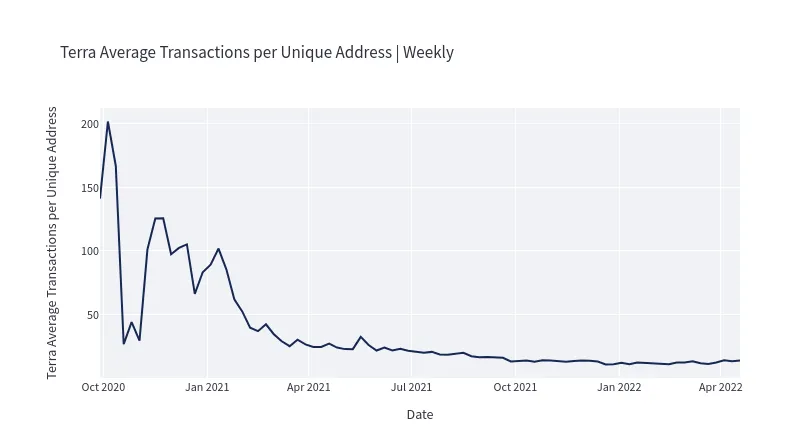
What the above graph tells us is the number of transactions per unique active wallet address. This tells us how many transactions have been created on average per address.
Summary
The number of active wallets on the Terra ecosystem seems to still be on an uptrend, even though the monthly timeframe shows a slowdown of this uptrend. This could also be due to the current market conditions and social sentiment, even though the average sentiment seems to not fluctuate that much, other metrics tell a different story.
There are a lot more metrics that one could look into to get a better understanding of the growth and retention of users than just this metric, but this metric is definitely a good start!