Ecosystem Anchor
Question: Create a graph to show either: a) the token price (over a time period of your choosing) OR b) a bubble chart with total value locked, for all the Terra projects that depend on Anchor to create their yield.
Orion Money
The official business statement is that it is the first, fully decentralized, cross-chain stablecoin bank.
For Orion to provide the following service:
- Earn the highest stable yield on any stablecoins (15-25% APY)
It uses the anchor deposit contract in the background.
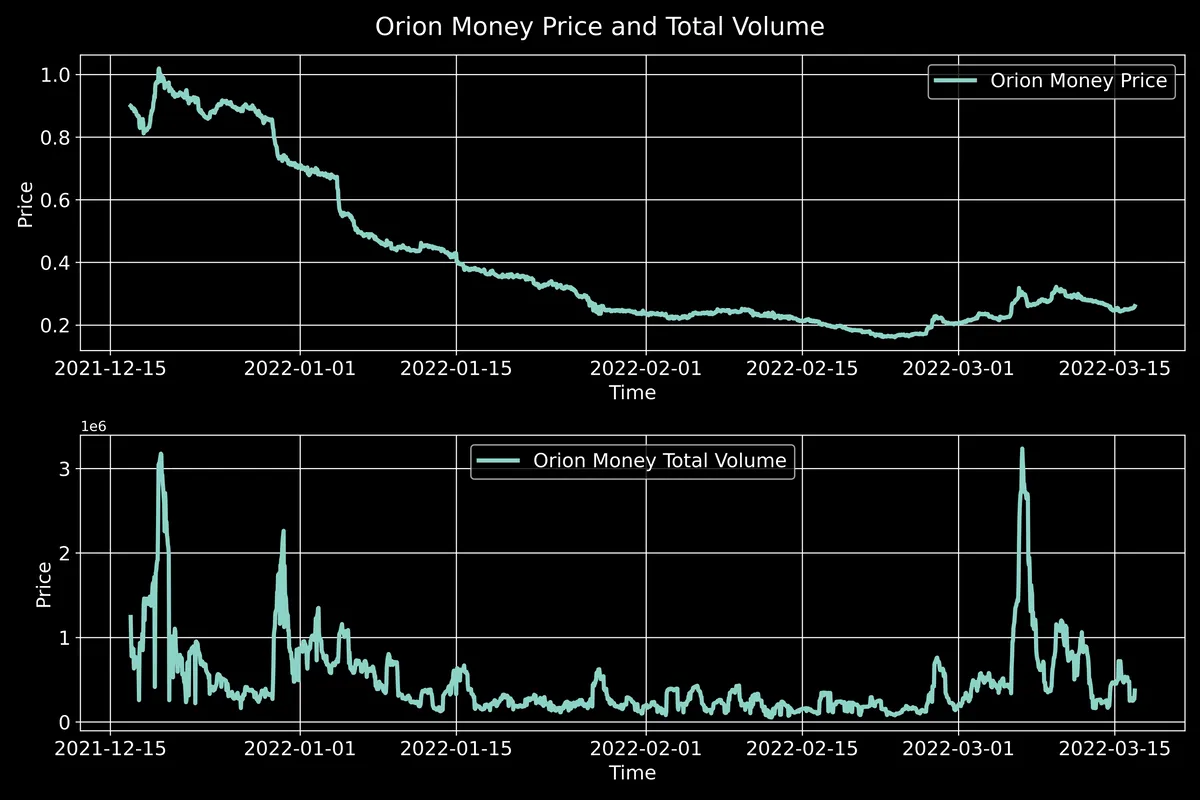
How has $ORION and $ORION Total Volume traded faired over the past 90 days?
As we can see the price of the token has been under constant sell pressure, until recently (end Feb, beginning of March).
This makes total sense as it was probably farmed and dumped. Although it may be that users at this price want to start utilizing their following offering more and more:
- Earn even higher variable yields by staking $ORION
Note: This is just the $ORION token TotalVolume (off-chain data) and does not include all their LP contracts from all the different chains as well. This would have provided a better indicator for project utilization.
Nexus Protocol Governance (PSI)
Their business statement is that Nexus Protocol is the decentralized gateway to yield-generating products in the ever-expanding Terra ecosystem. Specifically, it is an incentive token yield optimizer and liquidation protector.
What happens behind the scene, and how they utilize anchor contracts, is they get the bAssets that are being deposited, use the borrowing contract on Anchor and deposit the UST in the Anchor Deposit contract for yield.
How has $PSI and $PSI Total Volume traded faired over the past 90 days?
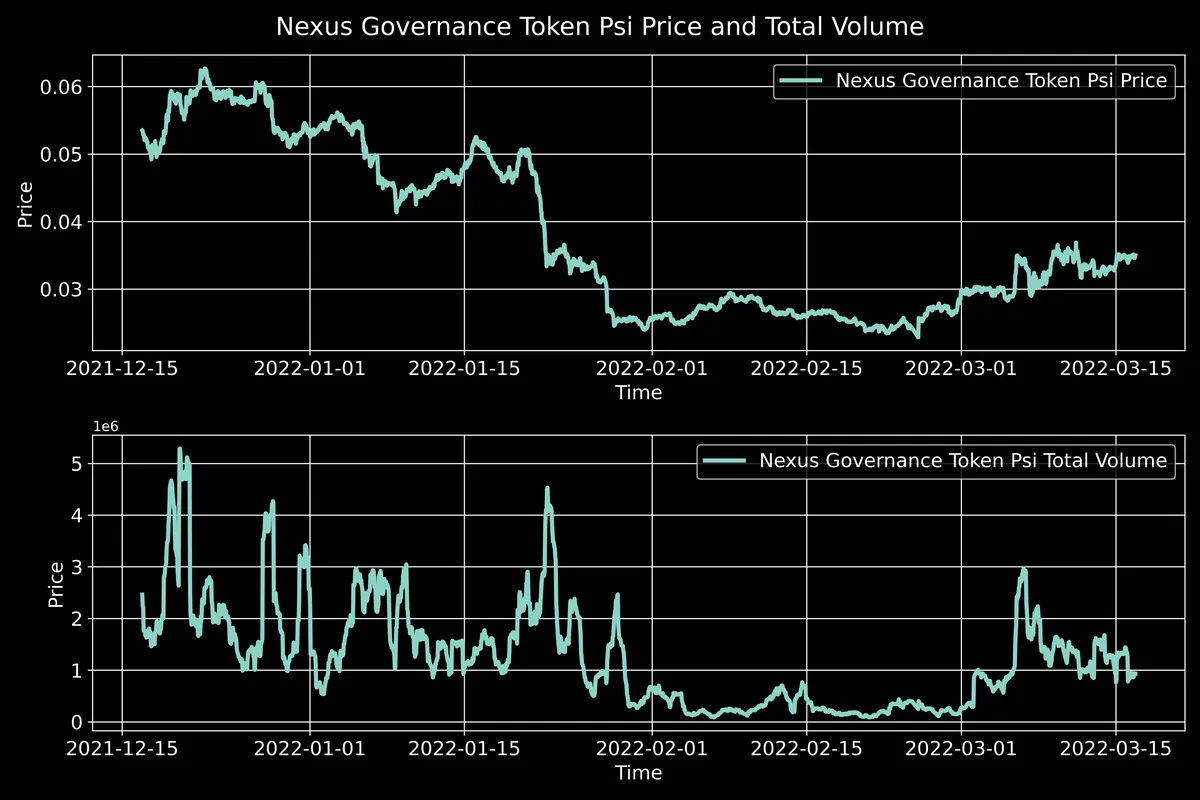
As we can see the price of the token has been under pretty consistent sell pressure, until recently (end Feb, beginning of March).
This makes total sense as it was probably farmed and dumped. With the new updates that the Nexus team posted on Twitter, this may have caused some hype, which is why we are seeing some sort of buy pressure in the last few months.
Note: This is just the $PSI token TotalVolume (off-chain data) and does not include all their LP contracts from all the different chains as well. This would have provided a better indicator for project utilization.