Redemption Arc

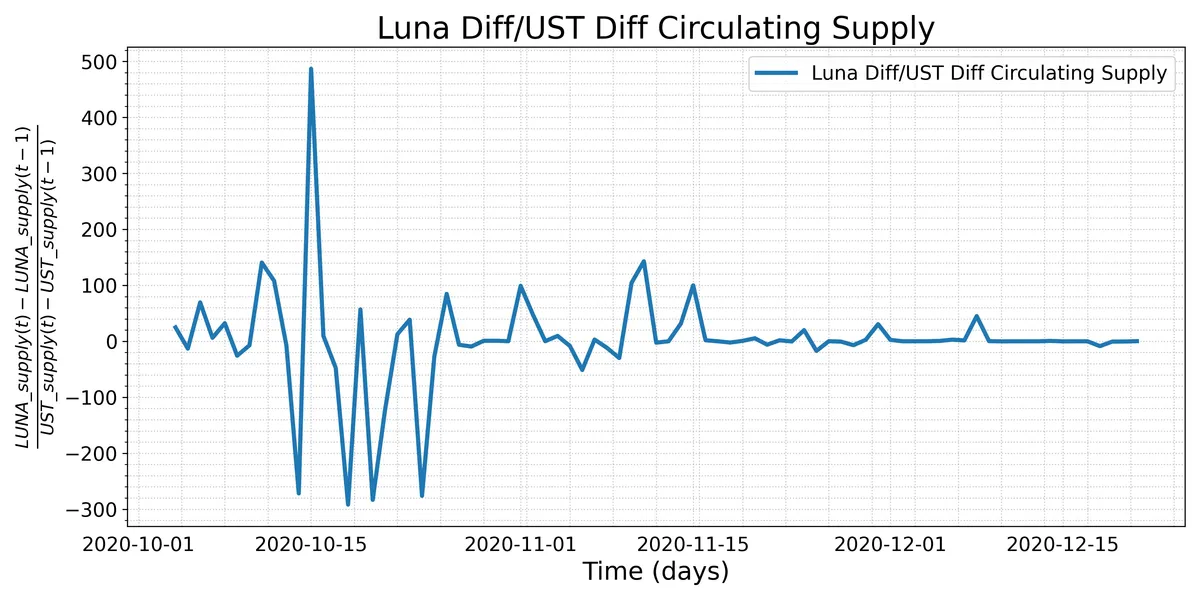
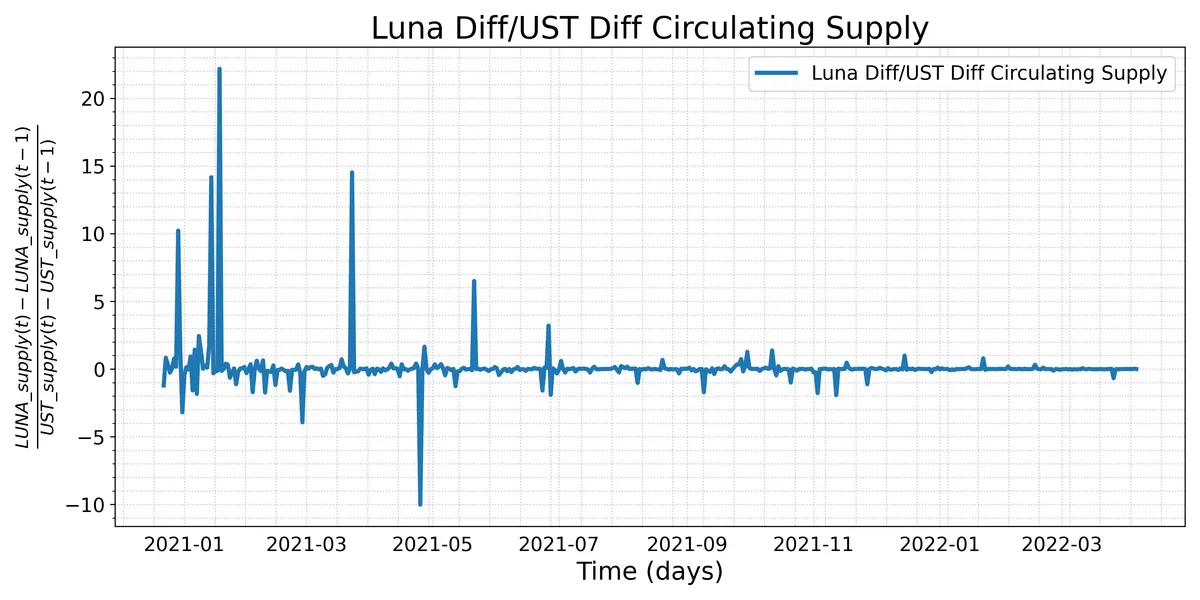
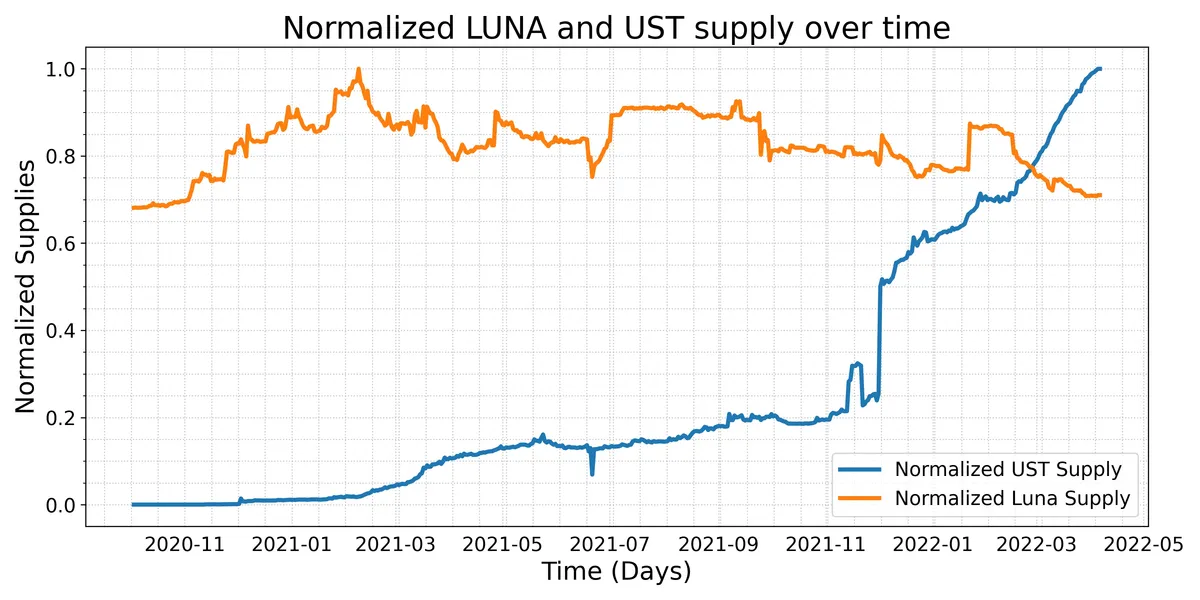
    Q177. Explore the limitations of redemption on Terra, i.e. the burn and mint mechanism. In what scenarios would the ability to burn & mint be insufficient for demand? Using data, illustrate occasions where these scenarios have occurred or come close to occurring. There are a number of ways to do this; one approach is to quantify a “Redemption Utilization”, i.e. a performance metric that encapsulates the extent to which demand for redemptions outstrips or comes close to the programmed caps, and then to explore the number of days over a specified time period that this metric has crossed a concerning threshold.

    Introduction

    There are multiple ways to get to a "Redemption Utilization" metric, or a proxy thereof. My approach may not be the approach commonly used in the industry, but I would like to think that it is stemmed in mathematical logic.

    Data gathering

    Firstly, we need the following:

    1. UST circ Supply
    2. LUNA circ Supply by day.

    We can get that information, alongside some more aggregates, from the terra.daily_balances as such:

    Loading...

    Note: The reason why there is a ROWNUM column is that I tried to take the UST_Supply - lag(UST_Suply) difference over the ROWNUM, which did not work, so I then resorted to doing it OVER DATE.

    Loading...

    A common graph, I've seen floating around is the above graph, which shows the price of Luna over time, coloured by the value of UST_Supply (UST Circulating supply over time). This is a nice general graph to look at how there is some surface correlation that is apparent with the price of luna and the supply of UST, but in my eyes, this is quite surface level and there are other ways to look into the mechanism in more detail.

    Surface look

    Let's now take a general look at the mechanism of burning LUNA for UST...

    A Deeper Look

    To look into this mechanism in more detail, I decided to get the data outside of the velocity (Flipside console), both for interoperability purposes and for ease of use.

    But before I did, I looked at this metric, being the LUNA Difference in circulating supply (day-by-day), divided by the UST Difference in circulating supply (day-by-day), to get something that looks like the following graph.

    Loading...

    The motivation for this graph came from attempting to find a way in order to show how the LUNA Circulating supply is affected by changes in the UST Circulating supply. What is meant by LUNA Diff is: LUNA Circ Supply (t) - LUNA Circ Supply (t-1) and by UST Diff is: UST Circ Supply (t) - UST Circ Supply (t-1), where t is Time in days.

    If we zoom in (see bellow), towards the beginning of this graph, what we can see is that there were wild fluctuations, day by day, where the LUNA circulating supply was 500x over the UST circulating supply. Yes, it was very early days and yes this could be because both tokens were still before their parabolic growth in circulating supply. What we can infer from just this graph is that due to the low circulation of UST and the demand for either redeeming or minting either of the tokens, there was this massive fluctuation in the ratio.

    db_img

    What we can also see, is that post that initial wild fluctuation and as the circulating supply of UST started increasing, the fluctuations decreased (see bellow).

    db_img

    What is clear is that these fluctuations come from some sort of demand for the burn-mint mechanism and could also be potentially visible in the UST peg.

    The above observations about how low the UST supply was in the initial fluctuation time can also be backed-up by the following graph:

    db_img

    The above graph shows the normalized LUNA and UST supplies over time. What we can see is that there is no way to observe this 1-1 correlation for the minting-burning of assets, but that the overall trend of LUNA circ supply has been downwards and for UST upwards. Also what can be seen is those periods of extreme fluctuations in demand. Not as clear as in the Diff ratio graph earlier, but clear enough to be able to see them.

    Summary

    Just looking at the above analysis and graphs we can see that the lower the circulating supply of UST the more the whole mechanism of burning LUNA for UST will be in trouble. There is not an apparent sign of the supply of UST growth slowing down in growth, so there is no cause for concern as of now. But nevertheless, the whole ecosystem could still be in danger of a "bank run"!

    LFG buying BTC, will help supplement the mechanism and circumvent a massive scale "bank run" on Terra, as long as BTC still holds its value as an asset.