Scanner Sweep
Q175. Bounty question #157 was to create a dashboard to show the health of the Terra ecosystem.
For this bounty, your job is to write a succinct one-page summary or summary dashboard assessing a submission of your choice for the Acme of Skill bounty #157. Grand prize winners will compare at least two of these submissions.
Luna Intelligence Dashboard
An all-in-one dashboard that has surface level analytics for different projects, as well as Terra-specific statistics. It has everything from all the major protocols + NFT marketplaces as well as things about the LFG.
The Anchor, as well as the general Terra statistics, are very well done, are being kept up to date and contain a lot of useful information in a concise and useful way. What is lacking, is similar metrics across all of the different protocols in the ecosystem. Also, in some of the protocols, there are just plain-text links posted to either flipside dashboards or external analysis. This is fine, but it means that anyone interested in that information does not have an all-in-one place they can consume it, but they have to go to multiple places to get it, manually or via their own preferred method. Leading on from that for the Luna Liquidation queue for example there could be a lot more detail provided, such as the liquidation nodes. This data is available in multiple places, even without staking ~ 5000 KUJI to have access to it. I am guessing that the person/people maintaining it, add things as they do or search for bounties and this is why the site gets updated periodically at a slow pace.
I feel like this alongside more metrics (custom or otherwise), would make the site a one-place stop for all that anyone would like to know about how the x protocol or y marketplace is doing.
Terra Blockchain Dashboard
A dashboard that has a more refined tone, in terms of what it is looking for, one that has everything crammed into one page, without feeling too overwhelming, but that maybe lacks diversity in protocol coverage and other more specific, drill-down metrics.
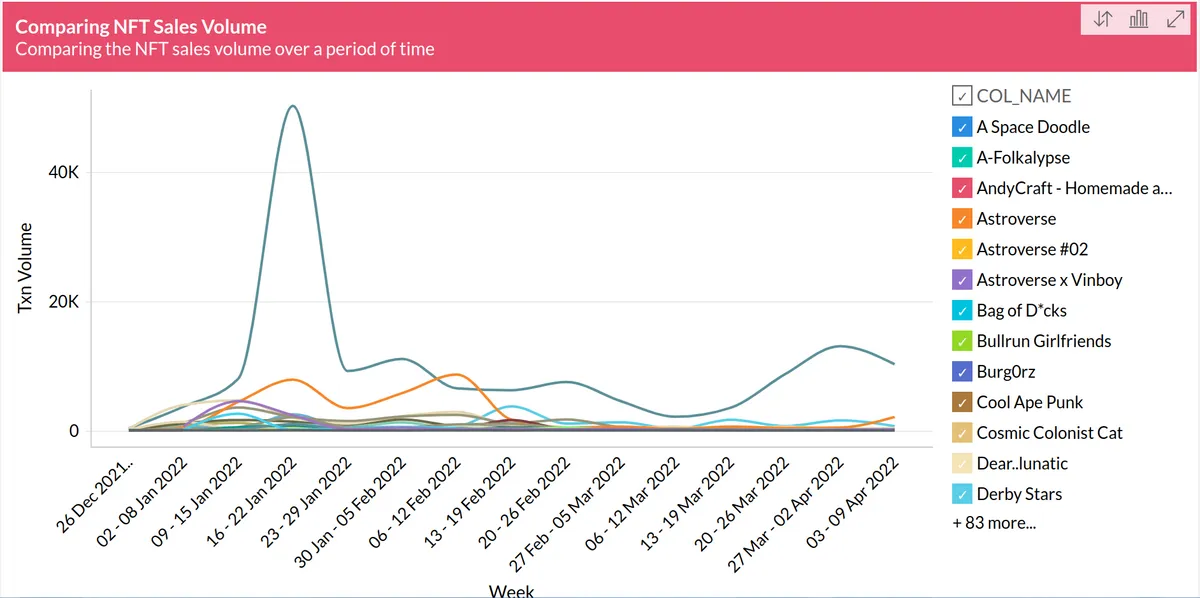
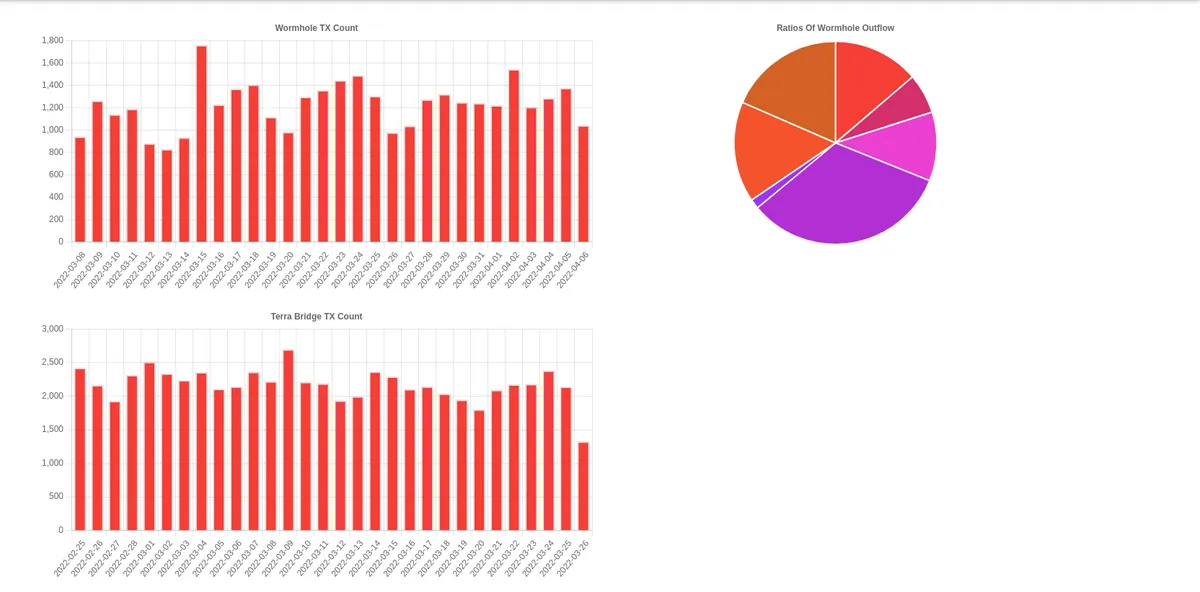
The first thing that anyone can see here on the front page is the Total Value Locked in the ecosystem as well as the different protocols, the Stable-coin peg and UST trading Volume on chains such as ETH. Such metrics are unique and off-the-top giving the site a very cosy and useful feeling. On the next page, for LUNA and UST supply metrics, for LUNA Burn and amount of LUNA burnt as well as other useful and specific stable-coin metrics give the sub-site a very coherent feeling as it feels like you're reading a report. The rest of them have a very similar feeling, with the ones that stand out the most, in my subjective opinion, are the NFT and the whale one, with multiple different visualization tools and metrics to tell a complete story. Also, last but not least, there is a Help section that explains things to newbies in the ecosystem, which would always be appreciated by newcomers. Now, on the other hand, I feel like this site would benefit from project-to-project specific analysis and metrics as well as maybe extra sections such as bridged asset metrics, and inflows/outflows from the Terra ecosystem. The help side could do with some extra information, maybe describing the metrics, or even adding a ?, questionmark, that contains helpful information about what someone is looking at.
Summary
In conclusion, both of the dashboards contain unique metrics and insight into the Terra ecosystem and its protocols, both in different levels of depth and with different or similar metrics. The Terra Blockchain Dashboard is the more user-friendly one of the two, as I've sent it to a few of my newbie friends and they've found it easier to read. Now that being said, they could both do with some more advanced plotting libraries, but that is more of a personal preference than a requirement, as the data is displayed in a beautiful and concise way in both of them.
If I had to choose one of the two, I would choose the Terra Blockchain Dashboard, mainly because it is comparatively really easy to consume information off-of and has enough aggregate and useful metrics for decision making.