Bitcoin Price: Anticipating the 2024 Halving?
In this dashboard, we analyze the parameters of the Bitcoin network to determine whether the price of Bitcoin has anticipated the Bitcoin halving events, a question of interest for many cryptocurrency enthusiasts. To answer this, we examine various parameters such as price, user activity, trading volume, transaction count, active wallets, and more. The objective is to compare these metrics between 2024 and 2020 and forecast potential outcomes following the April 2024 halving.
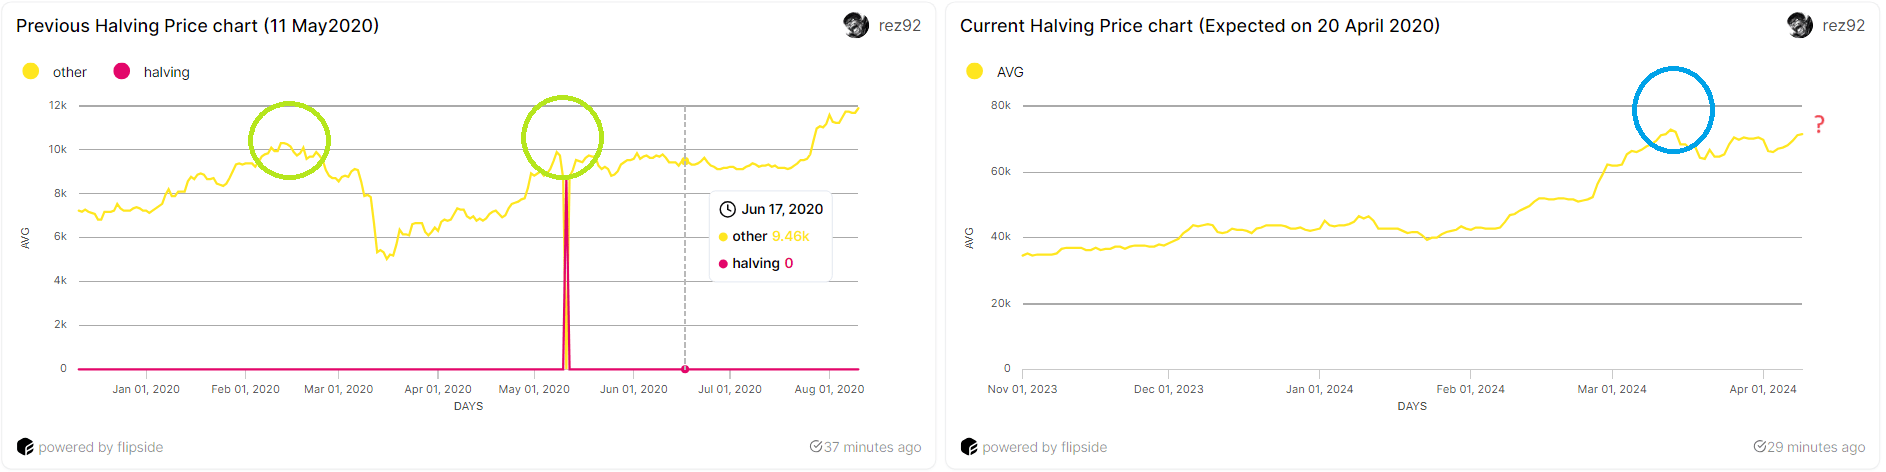
As demonstrated above, comparing Bitcoin price movements in the six months leading up to the halving event of May 11, 2020, and the anticipated halving event on April 20, 2024, reveals a similar pattern. In 2020, the price chart experienced an upward trajectory, reaching its previous all-time high (ATH), followed by a bullish trend after several months of ranging. As of 2024, we observe a comparable pattern, suggesting the likelihood of a bullish trend following this year's halving event.
The overall average number of active wallets remains consistent, at around 3 million per week, both around the 2020 halving and leading up to the 2024 halving. Additionally, there is an increase in the number of active wallets in the weeks before and after the 2020 halving. also we dont see decrease in active wallets despite of bearish marekt of last 2 years Therefore, we anticipate a similar uptick active wallets following the 2024 halving.
The transaction volume increased leading up to the May 2020 halving after experiencing a dip, followed by an uptrend afterward. In 2024, we observe an uptrend leading up to the expected halving day after a dip, suggesting a possible uptrend after the halving.
The volume of BTC transfers under 10 units experienced an uptrend leading up to the halving event, rebounding after a decline in 2021, and further rising post-halving. In 2024, although the number of transfers initially exhibited a bearish trend, there was a notable increase around April 20th, indicating a potential upsurge post-halving.
The average BTC transfers across all three categories have been at lower levels compared to 2021. In 2021, their trend experienced a slight increase after the halving. Therefore, we can expect similar results in 2024.
The transaction count decreased leading up to the May 2020 halving and experienced an uptrend afterward. In 2024, we observe a downtrend leading up to the expected halving day, suggesting a possible uptrend after the halving.
This dashboard is authored by RezaCrypto, me!
You can connect with me on Twitter: https://twitter.com/RezaCrypto_
and Discord: Rez92#
Please note that all information and analysis presented here are my own ideas. Always remember to do your own research (DYOR).
Based on the analysis conducted, there are several positive indicators suggesting an increase in BTC price following the 2024 halving:
-
Historical price movements: Comparing the price trends leading up to the 2020 halving and the anticipated 2024 halving reveals a similar pattern, with an upward trajectory and bullish trend observed after the halving event in both cases.
-
Consistent active wallet numbers: Despite fluctuations, the overall average number of active wallets has remained steady, with an increase observed before and after the 2020 halving. This suggests a potential uptick in active wallets following the 2024 halving.
-
Transaction count and volume trends: While transaction count decreased leading up to the 2020 halving, it experienced an uptrend afterward. Similarly, transaction volume increased following the 2020 halving. Despite a downtrend leading up to the expected 2024 halving, an uptrend is anticipated afterward, indicating a possible increase in BTC price.
-
BTC transfers under 10 units: There was an uptrend in the volume of BTC transfers under 10 units leading up to the 2020 halving, with a rebound after a decline in 2021. A notable increase in transfers around April 20th, 2024, suggests a potential upsurge post-halving.
-
Average BTC transfers across all categories: Although lower compared to 2021, there was a slight increase in their trend after the 2021 halving, indicating a positive outlook for 2024.
Overall, these analyses provide optimistic signals for a potential increase in BTC price following the 2024 halving. Based on the analysis, historical trends, consistent active wallet numbers, and transaction volume suggest a positive outlook for BTC price post-2024 halving.
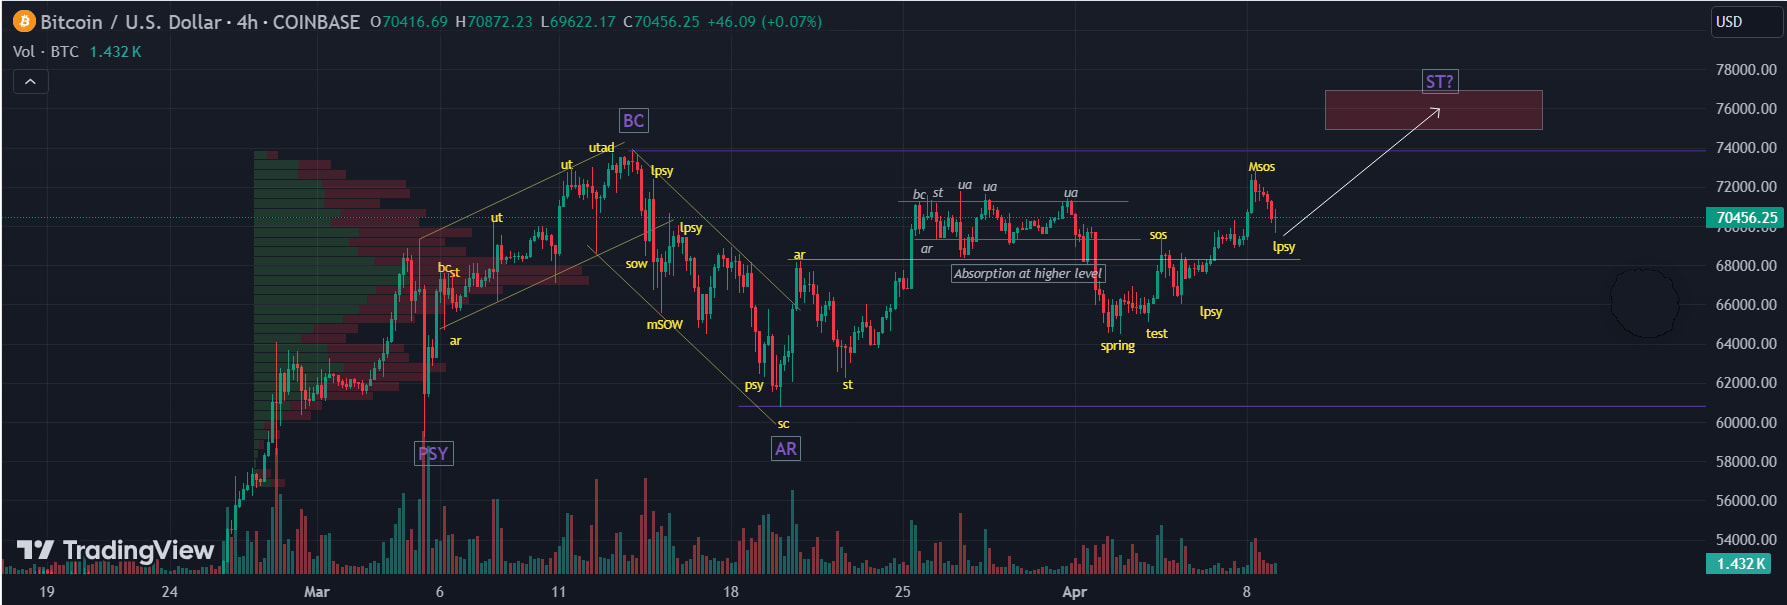
Here's a more detailed technical analysis that provides a clearer perspective on future price movements:
BTC appears to be low on supplies, but utilizing point-and-figure targets has enabled the accumulation of approximately $6000 from 12 columns, each valued at $500. When added to its existing $70,000, BTC is aiming for a target around $76,000, with a potential deviation of around $1000.
The analysis suggests that beyond this target, BTC is unlikely to experience further upward movement without undergoing a period of "reaccumulation." The nature of this phase—whether it entails a rapid ascent, descent, or a period of consolidation—is uncertain at this point.
Moreover, there's a notable observation regarding the potential alignment of this phase with the upcoming "halving" event. This alignment could potentially lead to a sell-off event, ideally pushing BTC past the $60,000 threshold. However, it's emphasized that it's too early to draw definitive conclusions regarding this possibility.