DEX Season
This dashboard is dedicated to the analysis of DEX and how the collapse of FTX affected users
Issues covered:
-
How have the number of DEX users changed? Are there more unique users?
-
Have the number of swaps changed?
-
Has the volume (in USD) changed?
\
What does this dashboard include?
This analysis includes multiple exchanges and 11 different blockchains: Arbitrum, Avalanche, Binance, Ethereum, Flow, Near, Optimism, Osmosis, Polygon, Solana, Terra and Thorchain
Plan:
- To begin with, I analyzed the overall picture: in the context of different periods of the FTX collapse (the periods will be described in the “Date”), in the context of chains, as well as how the metrics behaved 3 weeks before the collapse and 3 weeks after (more details also in the “Date”). Issues covered:
- Number of Swaps
- Number of DEX Unique Users
- Number of DEX Users (no unique)
- Next, I analyzed various DEXs on the following chains: Solana, Ethereum, Osmosis and Thorchain. Issues covered:
- Number of Swaps
- Volume (in USD)
- Number of DEX Unique Users
- Number of DEX Users (no unique)
Data:
- Tables for Arbitrum, Avalanche, Binance, Optimism, Polygon blockchains have the same structure. I took the data from the
name_of_chane.core.fact_event_logs tables,then filtered them, whereorigin_to_addresscorresponds to the address column inthe name_of_chane.core.dim_labelstable (wherelabel_type= 'dex'). Additionally, I filtered the data by the following items:event_removed= 'false' andtx_status= 'SUCCESS' - The tables for the Ethereum, Flow, Near, Osmosis, Solana, Terra and Thorchain blockchains have a different structure. I took the data from the tables
flow.core.ez_swaps,near.core.ez_dex_swaps,osmosis.core.fact_swaps,solana.core.fact_swaps,terra.core.fact_swaps,thorchain.core.fact_swaps, swapsethereum.core.ez_dex_swaps
Date:
Conventionally, I divided the time into 3 periods: Before, After the collapse, and also the interval between these two periods, when we observe the main impact from FTX Collapse:
- Before FTX collapse - before 8 of November
- Main impact of FTX collapse - 8-11 of November (including November 8 and 11)
- After FTX collapse - after November 11
I also analyzed the total number of swaps, unique users and users 3 weeks before and 3 weeks after the “Main impact of FTX collapse” period
NUMBER OF DEX UNIQUE USERS
NUMBER OF DEX UNIQUE USERS (no unique)
* For the convenience of reading the two charts above, it is better to turn off the view of some chains and consider them separately
The number of transactions at Solana has strongly increased. From 6M to 2.55 M (+135.29%). The number of swaps also increased for Optimism (+7.45%), Thorchain (+12.27%), Near (4.66%) and Terra (+55.67%)
We see the largest percentage decrease in the number of swaps in Flow (-32.9%), the number of swaps in Binance (-19.19%), Ethereum (-25.73%), Avalanche (-22.96%), Polygon (-5.93%), Arbitrum (-24%), Osmosis (-28.45%) also decreased,
If we talk about the time period from November 8 to 11, then all chains have a small (some very noticeable) increase in the number of swaps.
* For the convenience of reading the two charts above, it is better to turn off the view of some chains and consider them separately
The number of Unique Users in almost all chains has decreased. Osmosis (-32.9%) showed the largest decrease in this metric, followed by Avalanche (-29.08%) and Terra (-22.83%). Also, the number of unique users decreased for the following chains: Ethereum (-16.3%), Binance (-11.99%), Arbitrum (-10.93%), Solana (-5.26%), Near (-20, 13%), Flow (-13.7%)
A significant increase in the number of unique users is observed in Thorchain (+48.18%). Optimism has +16.4%, Polygon has only +0.095%
Overall Conclusion
More detailed conclusions were made after each section. Below is a summary:
- FTX Collapse had the most impact on Solana. Also, Solan can see a noticeable increase in the number of failed swaps after the news about FTX
- Most chains see a drop in swaps after the main FTX Collapse-
- The volume of swaps in USD after FTX Collapse is less than for the same period before. However, the price of tokens has decreased quite a lot since the FTX crash.
- A noticeable increase in the number of unique users of DEXs after FTX Collaps is not observed. From the analyzed chains, an increase in unique users for Flow, Optimism and Thorchain can be noted
* For the convenience of reading the two charts above, it is better to turn off the view of some chains and consider them separately
In contrast to the number of unique users, the number of unique users in most chains has increased. Avalanche (+58.8%) sees a significant uptick in user counts, with a big spike in user counts on November 27-28. Also, the value of this metric increased for Thorchain (+12.3%), Optimism (+8.85%), Terra (+46.09%), Binance (+3.26%), Solana (+135.29%) , Near (+2.4%), Polygon has only +0.74% of difference
A decrease in the number of this metric is observed on Flow (-35.58%), Arbitrum (-18.89%), Osmosis (-28.56%), Ethereum (-23.65%)
SOLANA
NUMBER OF SWAPS
Subtotal:
If we look at how the number of users and number of swaps changed after FTX Collapse, we can see that basically the situation is as follows: for most chains, the number of swaps and unique users decreased, the number of non-unique users increased
Next, I will consider in detail how the volume of swaps for the following chains has changed:
- Solana
- Ethereum
- Osmosis
- Thorchain


ETHEREUM
OSMOSIS
THORCHAIN


- A large number of failed transactions over the analyzed period, a bigger number of failures are observed after the start of the FTX collapse. The number of successful swaps for the entire period is only 12.5%
- The total number of swaps after the collapse increased significantly. The bulk of the swaps (especially after the peak of the collapse) falls on the Jupiter Aggregator. Looking at the DEX, the number of Jupiter Aggregator swaps increased by 200.66%, Orca + 9%, Saber 37.9%, the number of swaps on Raydium decreased by 42.87%
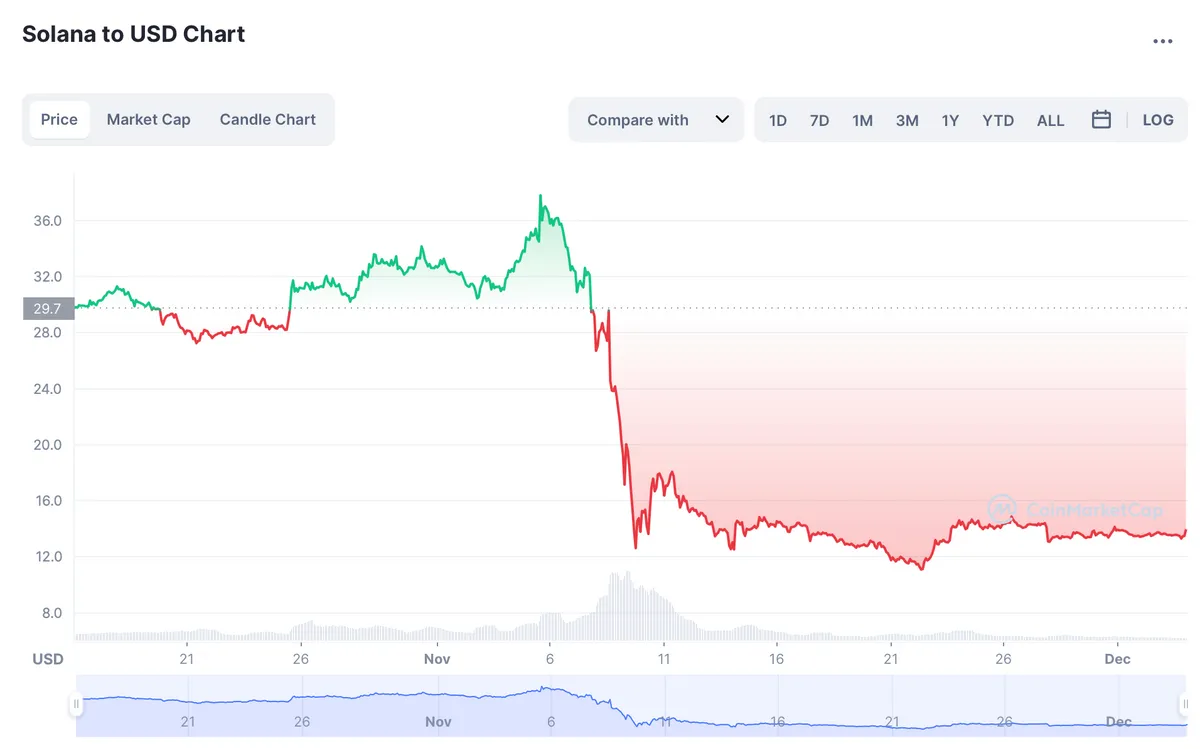
- The total volume of swaps in USD after the collapse is practically the same as before. However, this is due to a very strong depreciation of the tokens. So, for example, on the screen from coinmarketcap you can see how Solana’s native token (SOL) fell
- The total volume in USD is observed only in Saber (+63.69%). On other DEXs, this metric decreased: Jupiter Aggregator -16.94%, Orca - 66.3%, Raydium -35.74%
- The number of unique users has not changed much. The percentage changes are as follows: Saber +30.8% (total +111 unique users), Jupiter Aggregator +6.79%, Orca - 23.78%, Raydium -1.96%
- The number of users of Jupiter Aggregator increased quite a lot from 1.8M to 5.42M (+201%) . Percentage changes for other DEXs are as follows: Saber +37.9% (total +111 unique users), Orca +9.04%, Raydium -42.87%
-
The number of swaps on all analyzed Ethereum DEXs remained practically unchanged, except for Uniswap 2. The value of swaps on Uniswap 2 decreased from 1.58M to 1.04M (-34.18%)
-
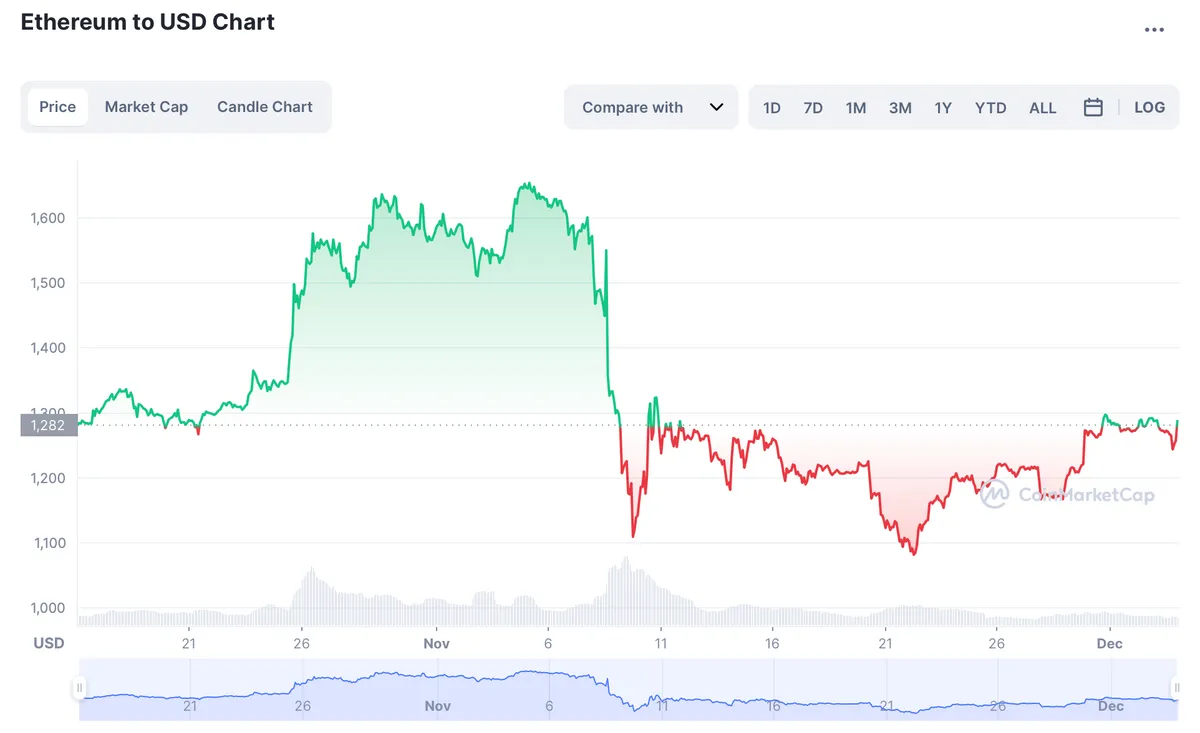
The total amount of swaps in USD on all DEXs before and after the FTH collapse remained approximately the same. However, many tokens lost value against the dollar, on the screen from coinmarketcap you can see how Ethereum native token (ETH) fell over the study period
\
-
The number of unique and non-unique users has changed slightly. Significantly decreased the value of non-unique users of Uniswap 2
- As for Osmosis, the value of all studied indicators decreased: the number of swaps by 32.09%, the total volume in dollars by 16.89%, unique users by 37.4%, non-unique users by 32.08%
- On November 13, there is a significant increase in the volume of swaps in USD, while the number of swaps and users remains at the usual level
-
The researched metrics (except for the total volume in USD) at Thorchain increased slightly. The number of unique users increased from 4653 to 6895 (+48.5%)
-
The difference in the total volume in USD is 13M USD (approximately minus 3%), however, it is also worth considering that the price of tokens against the dollar has significantly decreased significantly since the collapse of the FTX