OP Price vs Swapper Activity - Is there a Relationship?
Is there a relationship between OP price and trade volume?
Work Description
In this dashboard, we will check whether the volume of trading OP token has a direct relationship with the price of this token or not? In other words, with the increase in the price of OP, will buyers rush to buy it with the possibility of higher growth or not? On the other hand, sellers will sell their tokens with the possibility that the price will fall after receiving a reasonable profit?
To conduct this study, we proceeded in the following steps:
- First, we need to determine the daily price of the OP token. For this purpose we use the
optimism.core.fact_hourly_token_pricestable, which contains the hourly price of the OP token, and it is enough to get the daily average of these numbers. - Then we will get the number of daily transactions of all OP liquidity pools.
- After that, we will draw a linear graph of the daily price and volume of daily trades in one graph.
- We also draw a scatter plot of the price and volume of trades. The slope and the intercept of the regression line of this chart are also determined, and we draw the regression line to see whether this line can be fitted to the above chart or not.
- Based on the statistical functions of Snowflake, we obtain the correlation coefficient of price and volume and calculate the R-squared metric .
- Based on the above parameters, we will draw a conclusion about the main question of this research, i.e. the dependence of the volume of daily transactions on the price of the OP token.
Since we are only looking for the relationship between the volume of OP transactions and the OP price in this dashboard, we use the data from Optimism's two main exchanges whose data are available in processed form in the Flipside tables, namely Velodrome and Sushiswap. Once we obtain the relationship between these two variables in these two exchanges, we can generalize it to other exchanges.
We know that the volume of Velodrome transactions is much higher than that of Sushiswap transactions in Optimism, but we will use both exchanges and examine each separately.
Analaysis Sushiswap OP Trades
As mentioned above, we start with SushiSwap exchange to check the relationship between OP token volume and price. First we get the daily price of OP, then we draw graphs and calculate the correlation coefficient.

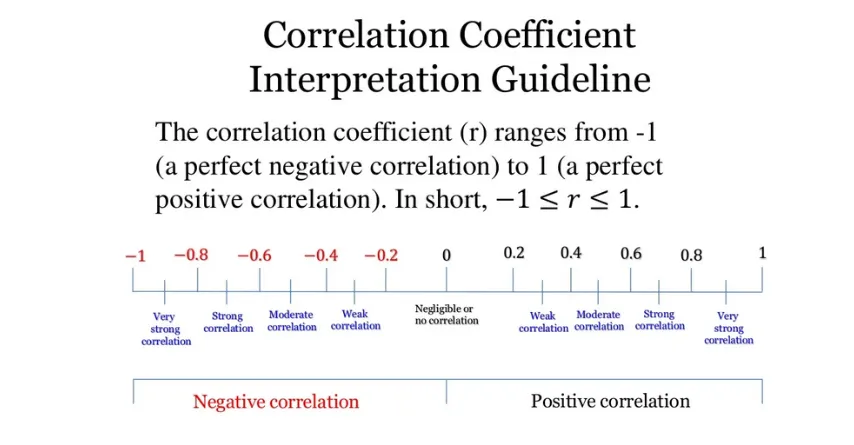
Correlation Coefficient
A correlation of -1.0 indicates a perfect negative correlation, and a correlation of 1.0 indicates a perfect positive correlation. If the correlation coefficient is greater than zero, it is a positive relationship. Conversely, if the value is less than zero, it is a negative relationship. (source)
R-squared is a goodness-of-fit measure for linear regression models. This statistic indicates the percentage of the variance in the dependent variable that the independent variables explain collectively(source)
Image Credit : Slideshare
Key Findings
- The most important point that can be seen from the above graphs is that as the price of OP increases, the volume of OP trades also increases, but it seems that there is little relationship between these two variables, i.e. the volume of purchases and sales and the price of OP.
- The correlation coefficient of these two variables is 0.4, which shows the relatively good dependence of these two variables, i.e., the volume and the price of OP, but the R-squared measure shows that only 15% of the changes in the volume of trdaes can be explained by the change in the price of OP.
- Thus, the relationship between the two variables, volume and OP price, can be seen in SushiSwap, but it is not very strong.
- Considering the much lower volume of OP transactions in SushiSwap compared to Velodrome, it is better to obtain the main result by examining Velodrome data.
Velodrome Analysis
We calculate the same analysis and statistics as in the previous section for the Velodrome. Of course, since the volume of OP trades in the Velodrome is much higher than in SushiSwap, more charts have been created for this section.
Can We Fit a Regression Line ?
In the last step of this analysis and according to the observation of the linear relationship between the two variables volume and price, we obtain the formula of the regression line of these two variables and draw it.
As can be seen in the graphs below, the drawn regression line is largely consistent with the distribution of price and volume data.
Takeaway
According to the overall analysis, there is a relatively strong relationship between the OP price and the trading volume, but other factors besides the price are also effective in increasing the OP transaction volume, which may have an origin outside the onchain data.
Oh Yes! There is a very clear relationship between volume and price
-
This time, considering that OP's daily trading volume is much higher than the previous section, the existence of a direct relationship between two variables, volume and price, is quite clear. The correlation coefficient is about 0.67 and the R-Squared measure, which is equal to 0.45 here, proves a good and moderate relationship between the two variables of volume and price.
-
According to the statistical criteria (R-Squared), about half of the changes in OP buying and selling volume are related to its price changes.
About Me
Author : Mojtaba Banaie
Date of Analysis : 2022-10-05
Twitter ID : smbanaie
E-Mail : mojtaba.banaie@gmail.com
Discord : smbanaie#5528