Stability Fee (May 13)
Q4. How impactful is the stability fee (the interest rate) on DAI loans in terms of the impact on volume and dollar amount of loans taken out? How does activity with DAI tokens change when the stability fee is different?
Introduction
For this bounty, I will include some stability fee discussion - what it is and how it changes based on the decisions made by the MKR token holders, who govern the protocol. I will then do some data analysis for the stability fee in one year range, and I will look at what happens on a daily and weekly basis.
What is the Stability Fee?
There is a lot of information that can be found here. In summary, the Stability fee is a floating (variable) interest rate within the Maker's ecosystem. It changes depending on the demand of users borrowing DAI, the decision to increase/decrease the fee is voted by proposals that are conducted by the MakerDAO Interim Risk Teams. In addition, the Stability Fee ensures that there are no supply and demand imbalances, and that users can borrow their DAI without any events of de-pegging or any other risks. On the other hand, the Maker Protocol itself makes some profits through this Stability fee - it is its main source of income after all.
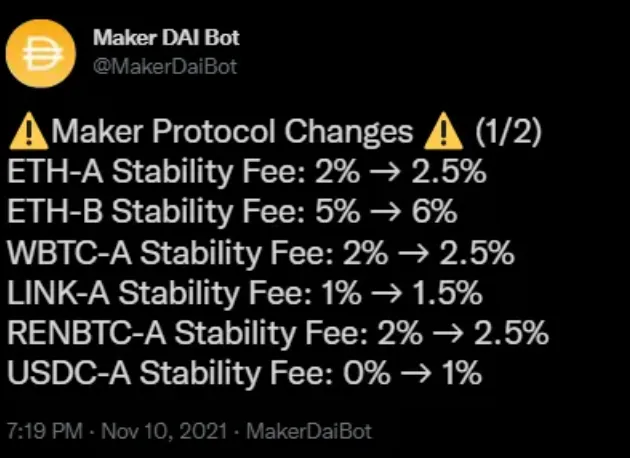
Looking at these 3 graphs all together, we can see periods when the stability fee has been increased, and periods when it has been decreased. We can see that there is some strong correlation - when the count of transactions increases and more DAI is being minted, the stability fee increases and vice versa. This is also correlated with some key dates of proposals being voted for by the community, such as the following:
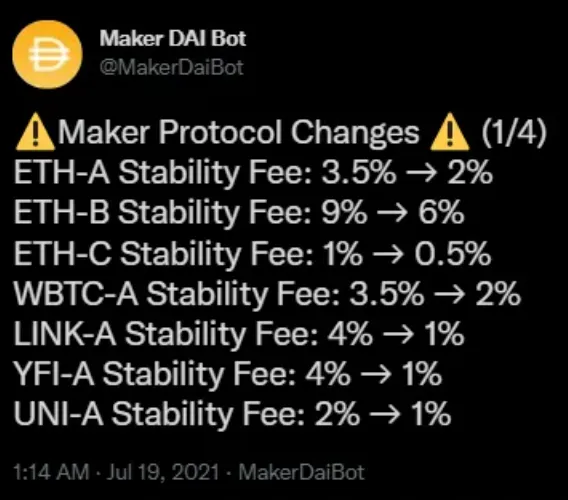
We can see a direct link between the charts and the tweets here, for example on the 19th of July the stability fee has been voted to be reduced, and we can see this happen in action a few days after the proposal has been voted for, the second chart shows that the fee has been reduced for a total amount of 2.2M $ on July 19th, followed by 17M $ on July 20th and almost 26M $ on July 21st!
These three graphs agree with the conclusion that I made earlier, that there is a direct response by the fee due to the proposals voting. There is not much more to the story here, we can clearly see that user activity has been consistent for the majority of the time, especially during the periods when the stability fee has been lowered.
Conclusion
This dashboard has investigated how the stability fee changes over time and what causes its change. The data analysis clearly shows the fast response of the fee's magnitude due to the community's decisions. We can see consistent activity during lower stability fee times and some small decline in user activity during an increase of the fee - however, this is pretty standard - after all, no one wants to pay higher fees!