Yesterday was… Well let’s not talk about yesterday, let’s analyse it
Introduction
What happened on the 9th of May 2022 many people will remember for a long time. For some, it was a day of losing almost everything, getting liquidated or losing what they were hodling closely to their hearts. For others, it was a day full of opportunity and the ability to take an advantage of the market. I must say, personally, I belong into the first group of people who will remember the past few days with a rather salty taste. All my previous dashboards emphasised my love for Terra, and what happened these past few days is still quite shocking to me.
I'd also like to say that my heart goes to anyone and everyone who is affected by this very unexpected event. I'm full of hope that Terra as a community will recover very soon and we'll be able to look back at these past few days only as a distant memory.
In this dashboard, I will look into what happened, how the PEG of UST was lost gradually and what caused it. I will also look into who took advantage of this 'Red Sea' and see how much inflow there was on certain exchanges, such as Binance or KuCoin. Furthermore, I will also include an analysis of aspects such as the amount withdrawn from exchanges and the amount circulated via different bridges.
What is important to remember throughout this dashboard is that every reason I state here is speculation and my personal opinion. Whether anyone really knows why Terra crashed so much is sadly beyond my knowledge, and for that reason, there won't be any finger-pointing at who is to blame in this dashboard - you will only find data analysis here!
Data Gathering
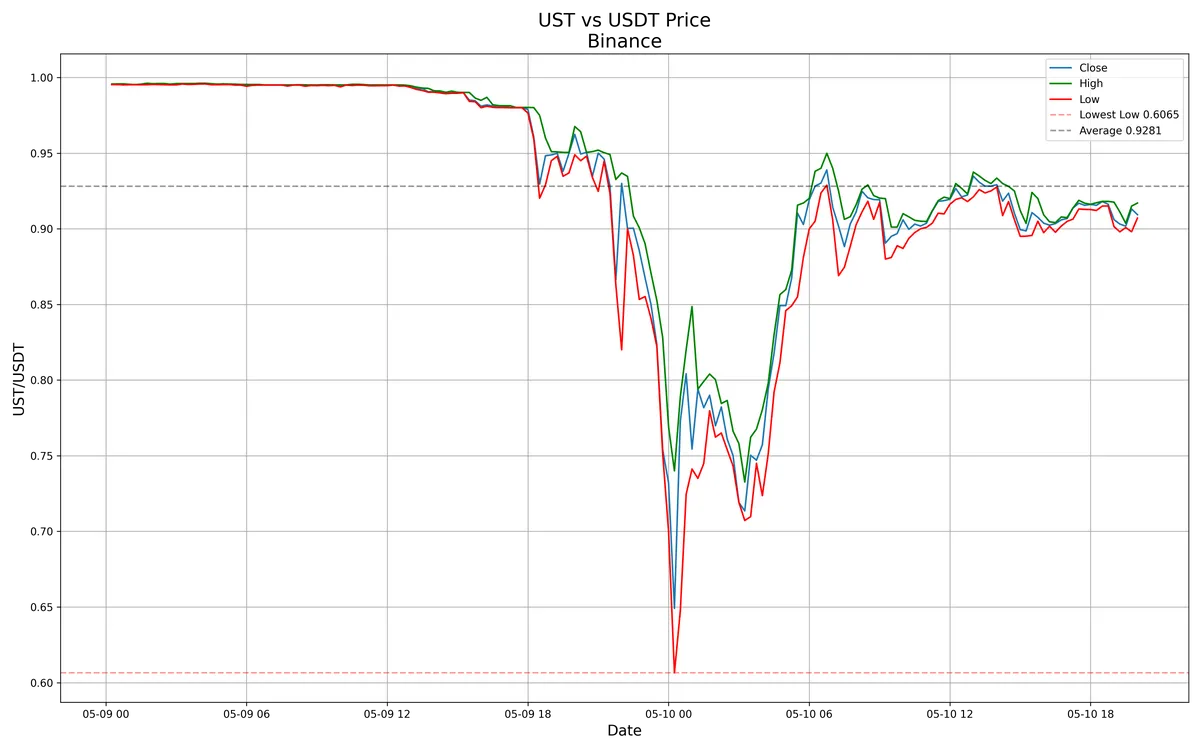
The data for the UST and its lost peg is sourced from Binance.
The graph below shows on-chain data, from a node that Flipside has access to as a validator. However, this data is wrong. We can see that the peg was lost to only about 0.9 at its lowest, which was not the case. In reality, the peg went to as low as around 0.2 (!!!) today, that is, on the 11th of May 2022 - 2 days after the attack had started.

One of the possibilities that could explain what happened in the past few days is the tweet shown above. The timing of the entire attack seems to be very unfortunate. Just as when the entire market is entering into a bear market - due to the interest fees increasing like crazy around the whole world - someone took a massive advantage and decided to pull out their UST from Terra. That caused panic and lead to others liquidating their assets very fast. We can see on Anchor that people started pulling out rapidly, which caused something similar to an avalanche (no pun intended here) - and a massive spiral down for both UST and LUNA.
In order to see the reality of UST and how it gradually lost its peg, let's have a look at data captured directly from exchanges.
Below are two charts - one taken from an interesting article that explains the reasons behind the value of UST going down. The second graph is plotted by me and shows data from Binance. We can see that UST went down to almost 0.6 on the 10th of May. At the time of writing the analysis, this has gone even lower now - with the minimum being 0.225 (as shown by Binance).

Who deposited and who withdrew?
In the second part of this dashboard, let's look at the general picture of inflows and outflows on Terra.
Firstly, we can see that people withdraw via the wormhole a huge amount of USD on May 10th, right after the attack started. The amount withdrawn has quieted ever since, probably because users don't want to convert their UST into fiat if it's not worth one dollar anymore...
Next, let's look at exchanges specifically.
We can see that people were mostly withdrawing into Kraken and Binance. The cumulative amount withdrawn right after the attack until the end of the day (9th May) is around 15.5B $ - that's a huge amount of money. Comparing it to my values calculated in the previous dashboards, Anchor's market cap was around 17B $ and here, we can see 15.5B $ gone within hours, and the current total amount withdrawn equals 66.2B $! I am simply lost for words.
Who took advantage of this crash? Well, we can see that quite a lot of people deposited their assets, again, using mainly Binance. The total sum of deposited USD is at 43.7B $ now - it's not surprising to me, given a great opportunity to buy LUNA at a 90%+ discount...
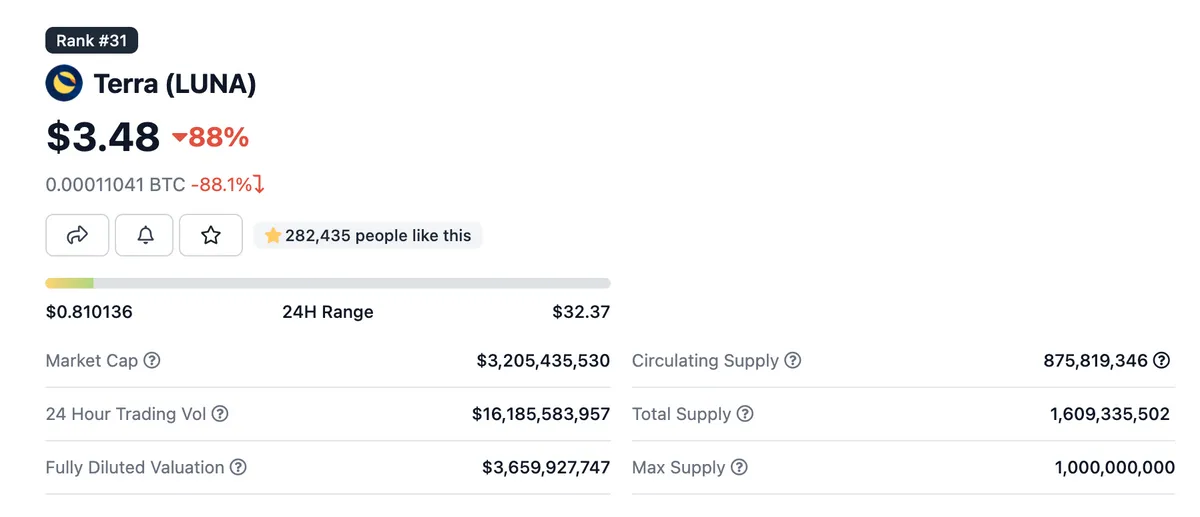
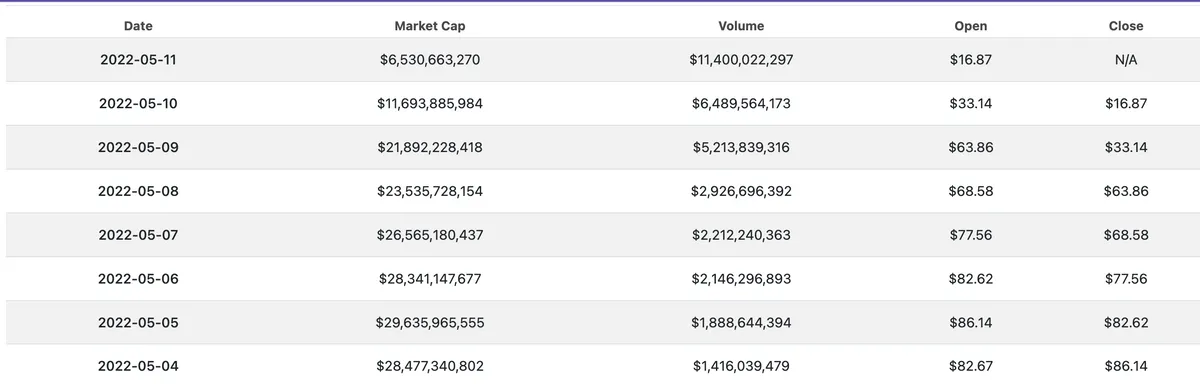
On CoinGecko, Terra was the 8th ecosystem sorted by the total market cap. Today, it's at 100th+ place. The total market cap went from 30B+ $ to just over 3B $... The graph above shows us the rapid decrease in LUNA's price - a wall straight down to the floor. We can also see the LUNA supply decreasing quite rapidly too.
Final remarks
This heartbreaking to many people event will be remembered for a very long time. The analysis provided here shows who took their money and ran - and who took an advantage of the whole situation. There were other opportunities too, such as arbitrage bots having a 20% LUNA-bLUNA trades. If I had more time on my hands, I would like to look into data from Kujira, and see how many people bought LUNA at an even discount, as the website shows that even 20% bids have been hit - probably for the first time since Terra was born.
In conclusion, the analysis here shows what happened in the past few days. As I mentioned before, I don't want to speculate on the reasons why and provide you with a bunch of tweets - as I'm sure no one wants to hear about possible reasons, just the actuality is what matters.
I'm hopeful that Terra will recover from this and that this dashboard will remain only as a sad memory of what happened on some day in 2022...