Anchor Pool Players
Investigating the attributes of Anchor pool players.
AMMs & Liquidity Pools
The crypto ecosystem is a market. A market of ideas, data, and most importantly, tokens. A decentralized economy requires a decentralized system of trade. So in crypto, there are applications known as Automated Market Makers (AMMs), that facilitate the seamless exchange of tokens using liquidity pools. Pools, as they're generally known, are a collection of funds in specified token pairs pooled together permissionless by users known as liquidity providers.
Pools make it possible for every decentralized finance user to trade tokens without KYC restrictions as it happens in traditional centralized exchanges (CEX).
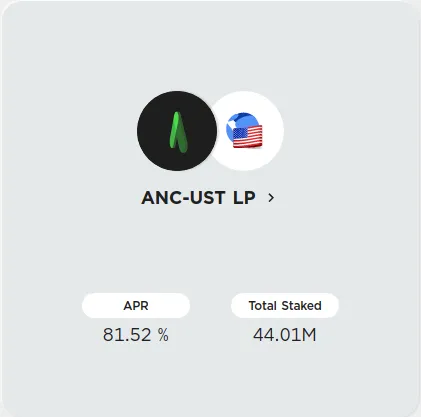
Anchor runs the ANC-UST liquidity pool via Terraswap which provides liquidity for users to exchange ANC tokens for UST and vice-versa. At the time of this writing, there were 44M+ LP tokens staked, and the incentives one stood to gain from the ANC-UST LP stood at 81.52% APR.
ANC-UST Pool History
To understand the attributes of ANC-UST pool players, we have to take a look back at the history of activities within the LP. The chart below shows the total sum of provisions and removals executed within the LP by month. Generally, liquidity removal frequencies are higher than liquidity provision frequencies although both kinds of events follow a clear pattern in a zig-zag manner suggesting that market trends influence LP behaviour.
To provide liquidity in any AMM, providers are required to provide equal amounts of each token in equal value. As in a 50/50 ratio. For example, in the ANC-UST LP, if I want to provide 20 ANC tokens, I must provide an additional amount of UST equivalent to 20 ANC.
Trying to guess the wealth profile of ANC pool players, one way to go about it is to get the average amount of liquidity provided. The USD part of the amount is multiplied by 2 to reflect the total amount at the time of provision. Since ANC is a fluctuating asset, this method is sound in maintaining coherent value across-board.
With monthly averages, we can profile pool players according to popular crypto wealth categories as follows:
- whales > $100,000
- sharks $10,000 - $100,000
- dolphins < $10,00
- fish < $1,000
- shrimps < $10
Based on the above category, we can say that the average ANC-UST pool player is a shark.
But has the average pool player always been a shark? For 8 out of the past 10 months, the average monthly liquidity provision has always been greater than $10,000 with an all-time high of $31K in November. In fact, liquidity provisions have been steadily increasing after the May crypto crash. This point is buttressed by the chart below showing the top 10 liquidity provision events in the ANC-UST pool.
You can see that 8 out of the top liquidity provisions happened after August 2021, which supports data from the previous chart and also indicates that ANC-UST pool players have been increasing their LP bags by making big liquidity provisions.
Summary of Findings
In this publication, we tried to assess the attributes of users who pool liquidity on Anchor via the ANC-UST pool by analyzing pool history, average liquidity provided by month, and the top 10 liquidity events. At the end of our investigations we came to the conclusions that, Anchor pool players are:
- Reactive to market trends
- 31K and counting in number
- Sharks by averages
- Securing big LP bags