Tinyman LP Actions
Show the number of mint and burn actions each day. -Create a table of the LP pools with the most mint and burn actions
Introduction
Tinyman is a reimagined decentralized trading protocol, utilizing the fast and secure framework of the Algorand blockchain to create an open and safe marketplace for traders, liquidity providers, and developers.
Liquidity providers are users who provide tokens that make it possible for traders to seamlessly exchange one token for another.
On Tinyman, when liquidity providers transfer assets to pool accounts, they mint pool assets. Hence, adding liquidity to pools are known as mint actions.
Similarly, when liquidity providers remove assets from pool accounts, they burn pools assets. Hence, removing liquidity is known as burn actions.
The mint and burn actions of Tinyman pools will be the focus of this analytical investigation. First, we shall look at the general mint and burn actions that have happened since tinyman inception, after that, we will breakdown the actions down and dive into each respectively.
The line graph you see below is a chart of the daily mint and burn actions that has happened over time. This metric is an important indicator of how active or inactive liquidity providers have been within tinyman pools.
When tinyman 1.1 launched at the beginning of 2022, the hype obviously got liquidity providers to transfer assets to tinyman pools. Then hype eventually died down but we can see that there are occasional spikes creating a zig-zag pattern. Burn actions have stayed pretty consistent since inception, hovering around 800 burns per day.
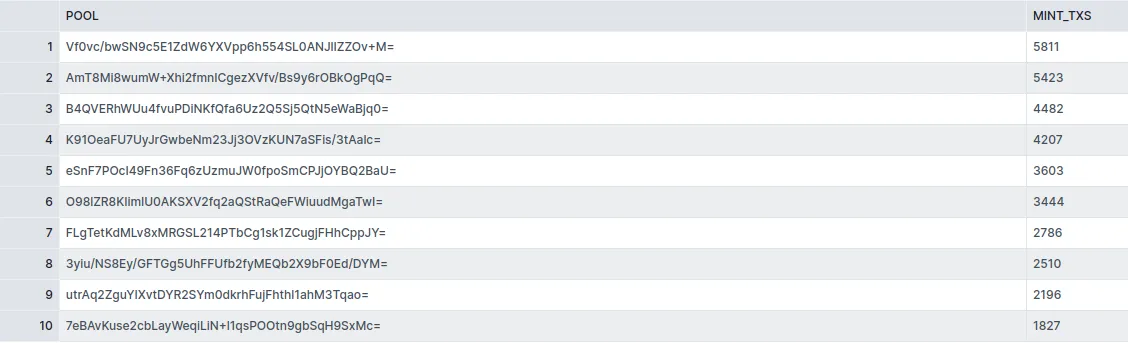
The top 2 pools each have over 5,000+ mint actions on the record while the next 2 also boast of 4,000+ mint actions. The 10th pool in our list boasts of 1,800+ mint actions.
The donut chart below gives a visual representation of the table. All pools outside of the top 10 are grouped into the category "Other".
As you can see, the top 10 pools with the highest mint actions are responsible for about 40% of all mint actions.
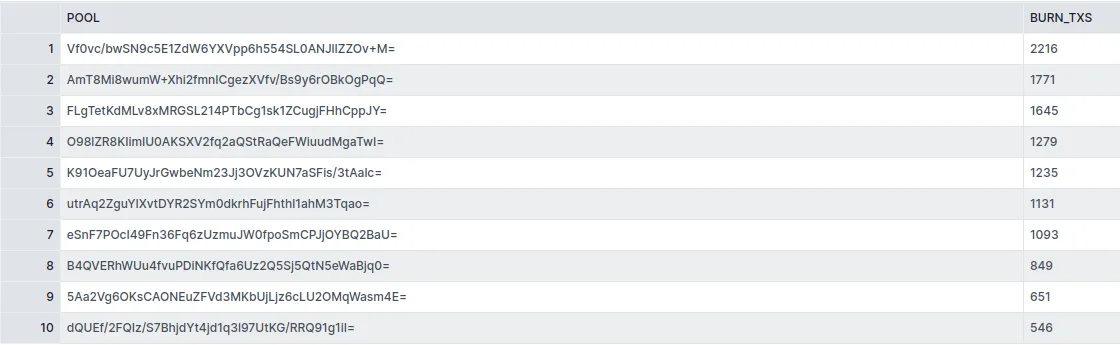
Confirming from earlier data, we can see that burns are much fewer compared to mints. Also, the pools with the highest mints are also the same pools with the highest burns.
The table above is visualized nicely in the donut chart below for more clarity.
Once again, the top 10 pools with the highest burn actions are responsible for approximately 40% of all burn actions. This is subtle proof of the correlation between burns and mints in tinyman pools.