Dex Season
#InTheNews7 #MetricsDAOBOUNTYS #ETHEREUM #POLYGONSUSHISWAP #SOLANA #OSMOSIS #DEX #FTX
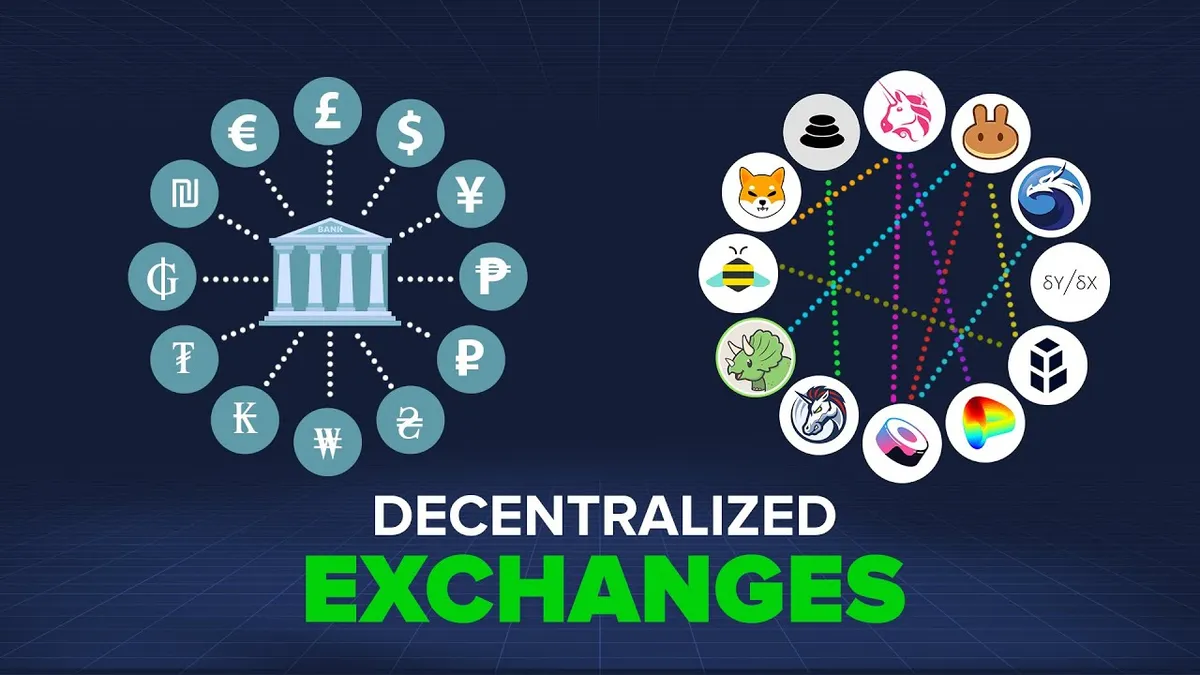


Welcome to the DEX Season!
A Decentralized Exchange (DEX) is a peer-to-peer market where users can buy and sell assets (Crypto-tokens) without giving their private keys to an intermediate.
When a user is Swapping, the DEX uses a Liquidity Pool (LP) to provide the assets, for example is someone wants to swap Osmosis Native Token (OSMO) for Centre Stable Coin (USDC), the DEX uses the OSMO-USDC Liquidity Pool to provide the user with USDC after the OSMO is added to the LP, so the balance between both assets change and that makes a price change, to prevent that the balance in tokens may be disrupted by large amount of swaps there are aggregators which are responsible to provide Liquidity to the LP in case of this events.
- This is a simple explanation of how DEX LPs works but for more information you can visit this link, here you can understand better the basis of LPs which are the most important thing for Decentralized Exchange Dapps to Work.
FTX Crash
At this point this event was discussed a lot but feel free to visit this link (Coindesk Timeline Article of FTX Collapse).
This Centralized Exchange (CEX) was a powerhouse in the crypto world prior to their collapse, but most of the Crypto CEX have a critical problem, they don’t have the same regulations as traditional CEX in real world such as banks, and in this year a lot of CEX crashed after Terra Blockchain Crash.
- Terra Blockchain Crashed, Which made a lot of users/investors assets to lost their value, because of that a lot of Money was lost and to prevent more damage a lot of them retire their funds invested in crypto projects such as CEX.
- One of this Projects a hedge fund called Three Arrow Capital crashed, dragging down a lot of other projects such as Voyager, because all of these projects invest large amounts of money in others projects.
- So like a Domino Effect, the Terra Blockchain Crash affected everyone, making a lot of Projects filling for bankruptcy.
- One of this Projects a hedge fund called Three Arrow Capital crashed, dragging down a lot of other projects such as Voyager, because all of these projects invest large amounts of money in others projects.
So FTX after surviving the Terra crash, was doing fine, but in the end thanks to Coindesk report about innacurate balance sheet, people starts again to withdraw funds which made another important crash affecting everyone.
FTX Crash impact on DEX
The goal of this dashboard is to look at the impact in activity/volume the FTX Crash made in differents DEX on distinct blockchain, so for my analysis i choose 4 different blockchains, Ethereum, Polygon, Solana y Osmosis.
The main goal is to see that overall the FTX Crash raise activity/volume during the Month of November, and see notable spikes/growth rate during the important days of the crash.

🔍 Analysis🔍
It doesn’t seem blockchains Active Swappers have a correlation, but we can see that most of them presents less swappers in the last months.
- Ethereum: Here we can see that November active swappers are more than before, this isn’t enough to correlate with FTX Crash, but is the result we expect to have with this chart.
- November Monthly Swappers (Red Bar), increases a lot in comparison with the past months.
- November Weekly Swappers (Yellow Bar), also presents a good increase in comparison with the pasth months.
- November Daily Swappers (Blue Bar), is really similar to other months.
- Polygon: Because the only DEX included here is Sushiswap, there isn’t a big difference in activity by months.
- November Monthly Swappers (Red Bar), decreases in comparison with the past months.
- November Weekly Swappers (Yellow Bar), presents a increase in comparison with the pasth months.
- November Daily Swappers (Blue Bar), presents a increase in comparison with the pasth months.
- Solana: The biggest difference between active swappers can be see here.
- All Active Swappers in November decreases in comparison with October.
- Osmosis: All Active Swappers in November decreases in comparison with October.
- Main reason?, October was the month when Binance Anounced their inclusion of $OSMO, raising a lot of activity.
🔍 Analysis🔍
The reason i started days before November, is because every user in the first day is going to be considered as “new”.
We can see that Solana and Osmosis, are the blockchains with more swappers, Ethereum with all the DEX in the data considered only reach 2k Swappers, and Finally Sushiswap Polygon with the less amount of Swappers.
Looking at Osmosis and Polygon Swappers, we can’t see a big correlation between the FTX Crash event (from November 6 to November 12) in comparison with Ethereum and Solana but:
- Polygon presents an increase of swappers during November 9&10, with an increase of the New User percentage too.
- Osmosis Active Swappers and New Swappers are constant during the event, and their activity decreases at the end of the Crash (November 11&12).
- Ethereum Swappers present a notable increase during the events from November 8 to November 10, New user percentage also presents a notable spike of 52% of New swappers in November 9.
- Solana Swappers are the most active of all the blockchains during the events of FTX, reaching their spike in November 9 of:
- Active Swappers: 13,857
- New Swappers: 13,172
- New User Percentage: 48%
🔍 Analysis🔍
In Swaps we can see a notable correlation with the Events of FTX Crash, the biggest exception is Solana with swap activity booming in November 23, the main reason?, Serum DEX one of the biggest affected by FTX Crash, was looking for a way to reborn again, causing the creation of OpenBook a fork of Serum DEX called the “Serum V3” which made a lot of noise in the Solana Community.
- Ethereum==: November 8 presents the biggest growth rate of 32% with a total of 160,685 swaps, November 9 reach the spike of Swaps in the month with 164,518 swaps.
- Most of the swap activity drops after the events of FTX.
- Solana: November 8 presents a growth rate of 95% with a total of 442,531 swaps, and this swap activity reach their spike in November 10 with 587,022 Swaps.
- In Solana we can see the biggest consequence of FTX Crash, first we have a lot of Swaps during the events, and days after this activity drops, But thanks to the efforts of the Serum Developers and the Solana Community, we can see a swapping trend increasing again after November 17 (day with the biggest growth rate of 114%), reaching the biggest spike of the month in swaps the day of November 23 with 588,716 Swaps.
- Polygon: November 8 presents the biggest growth rate of 116%, with a total of 10,628 swaps, November 9 reach the spike of Swaps with 11,905 swaps.
- Osmosis: November 8 presents the biggest growth rate of 51%, with a total of 67,446 swaps, November 9 reach the spike of Swaps with 73,651 swaps.
🔍 Analysis🔍
Again is possible to see a correlation of Swap Volume with the events of FTX Crash, during these days the amount of Volume is higher than the rest of the days.
Swap Volume here only considers the $USD amount being Swapped IN.
- Ethereum: November 8 presents the biggest Growth Rate with 363% and 13Billion $USD, November 10 have the spike in total $USD Volume Being Swapped with 33Billion $USD
- Solana: November 8 presents a Growth Rate of 169% (the highest during the FTX Crash) with 51 Million $USD in $SOL being Swapped in, and November 9 is the spike with most Volume reaching 64M.
- Polygon: November 8 presents the biggest Growth Rate of November with 277% and 1.8M $USD being Swapped In, November 9 reach the spike with a total of 2.1M $USD.
- Osmosis: November 8 presents the biggest Growth Rate and Volume with 147% and 18.33M $USD being Swapped in.
Summary
To answer the question better i’ll focus on the 3 metrics discussed.
- Users: It’s seems that the amount of users is higher in Solana and Osmosis, Ethereum presents a Notable difference in Active swappers during the month of November in comparison with the rest of the months.
- Ethereum Active and New Swappers increase during the FTX Crash.
- Solana Active and New Swappers increase during the FTX Crash.
- Polygon Active and New Swappers increase during the FTX Crash.
- Osmosis Active and New Swappers doesn’t increase during the FTX Crash, but their numbers are constant during the event and only decreases after that.
- Swaps: November 8 presents the biggest growth rate in Swaps for all the blockchains during the FTX Crash days, November 9 is the day with the most Swaps for all the blockchains, except Solana
- Solana reach their spike in November 10, and we can see that after the events of FTX, the swap activity raises again and reach a spike in November 23.
- Volume: November 8 presents the biggest growth rate in Swaps Volume for all the Blockchains and then:
- Ethereum: Reach their Swap Volume Spike in November 10.
- Solana: Reach their Swap Volume Spike in November 9.
- Polygon: Reach their Swap Volume Spike in November 9.
- Osmosis: Reach their Swap Volume Spike in November 8.
In Conclusion the DEX Activity increases during the FTX Crash, but after that the activity in DEX decreases, becoming more “Regular”, it seems that the CryptoMarket Crashes make users swap more, but in the end of these events the activity regains its normal state.
Methodology
Using Flipside Data Tables of Swaps, and my SQL Recipes learned in my Data Alchemist Bootcamp.
- Ethereum: Using
Ethereum.Core.ez_dex_swapsThis table have all the DEX Activity and have the Amount of Tokens in $USD so it was really easy to apply my recipes here. - Polygon: Using
Polygon.sushi.ez_swapsThis table only have information about the Sushiswap DEX in Polygon, but it has again the amount of Tokens in $USD, so again it was really easy to apply my recipes here. - Solana: Using
Solana.Core.fact_swapsandSolana.Core.Fact_token_prices_hourlyMy main problem here is the fact that joining these 2 tables is almost impossible without manual inputs, i can join these tables with date but the fact that token prices table only have “Symbol” doesn’t help with the Swaps table that only have “Token Address”, Label table also doesn’t have Symbol so i decided to only consider the $SOL token Swapped because is the most affected in Solana by the Crash, and then apply my SQL Recipes. - Osmosis: I already made a intensive Osmosis DEX dashboard here, so i was reusing my queries!.
Made by Popex404, Twitter Link here
MetricsDAO Bounty Question
With the collapse of FTX, do users want to remove their crypto from centralized exchanges and use decentralized options for trading? Examine the following:
- How have the number of DEX users changed? Are there more unique users?
- Have the number of swaps changed?
- Has the volume (in USD) changed?
Your analysis should include multiple exchanges and at least 2 different blockchains.