EVM - 4. The “Flippening” Comparison
If the data doesn't load i suggest to change your Browser. What is the Flippening? When really happened? On this Dashboard we'll look at Arbitrum and Optimism Performance combined against Ethereum and then we'll look at a direct comparison between these L2-Chains in 2023. Don't Know what is Optimism and Arbitrum? Read my Introduction to these 2 Blockchains.
Optimism and Arbitrum are Layer-2 Scaling Solution for Ethereum
Both Blockchains offers cheapest fees and faster transaction times, and to achieve that these blockchains uses:
> “Optimism Rollups” a technology where transactions are submitted directly to the L2, “rolled up” into a single proof, then sent to the layer one chain Ethereum to be verified. > > MagicLabs Example Arbitrum Guide
Optimism Rollups (OR)? That sounds like Optimism
> A rollup are regular smart contracts on the Ethereum Mainnet that serve as a relay between the mainchain (Ethereum) and Layer 2 > > An Optimism Rollup (OR) publish the bare minimum of information to the mainchain, generating proofs only in Fraud cases - A dynamic that makest them “Optimistic” > > From Gemini
Before to the OR, there was the Zero-Knowledge Rollups and the first zkRollup fully compatible with ==Ethereum== was Polygon.
When Optimism and Arbitrum Started?, Keys Differences in their Rollup Technology.
> Optimism was founded in 2019, introduced in June 2019 and a testnet was released in October 2019, in January 2021 the alpha mainnet launched and it took until October 2021 for Optimism to launch a version of the alpha mainnet that was compatible with the Ethereum Virtual Machine. An Open Mainnet launched in December 2021 - Decrypt
So it took a bit for Optimism to launch but after all the problems in 2022 they were already active Nowadays they’re working and testing a new blockchain architecture called Bedrock and if the testers like it, hopefully in 2023 is launched.
Arbitrum was launched on May 28, 2021 and they Forked Optimism optimistic rollups (ORs) Technology so in what sense they’re similar or different?
- Similarities in their ORs:
- Fraud Proofs
- Instant Finality
- Cross-chain bridges
- Differences in their ORs:
- Fraud-Proof Verification: Optimism OR uses single-round fraud proofs, while Arbitrum uses multi-round fraud proofs.
- Ethereum Dependency: The main problem for Optimism is that uses a Ethereum Virtual Machine (EVM) and Arbitrum has it’s own Arbitrum Virtual Machine (AVM) at the cost of having to translate EVM Dapps on AVM. So in the case of an Ethereum Problem Optimism will have more problems than Arbitrum because of the virtual machine used.
- And More.
You can read more about ==Arbitrum== and ==Optimism== Differences in this Makeuseof Article
What is the Flippening?
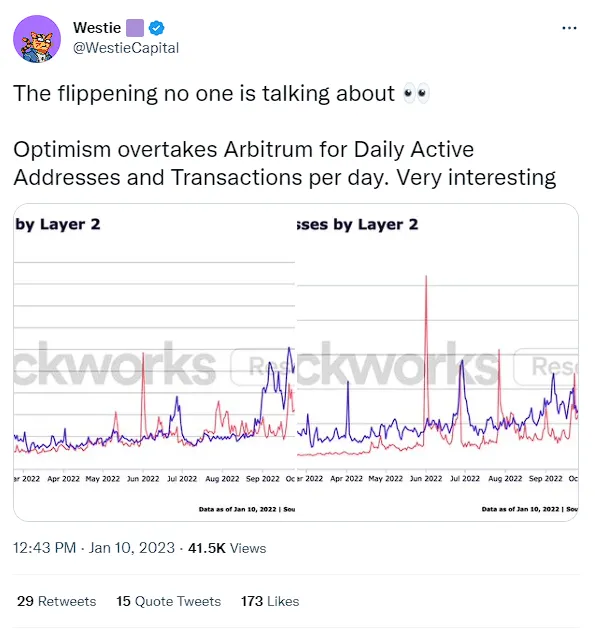
In January 10, 2023 @WestieCapital published a twitter thread from the insights obtained in their Dune dashboard, After this thread some Webs such as Cointelegraph or Blockworks announced these news.
- Westie was one of the first in naming this event as Flippening if not the first.
What Flippening Means?
The transaction performance of Layer-2 solutions for Ethereum such as Arbitrum and Optimism were reaching big numbers in the recent days, and because of that:
- The amount of Daily Transactions (==Optimism== + ==Arbitrum==) were higher than ==Ethereum== Transactions.
In this dashboard we’ll look more into the Flippening Event
- First we’ll look into a direct comparison between Arbitrum+Optimism and Ethereum, to see when the Flippening really started and compare the performance of Ethereum vs two of their Layer-2.
- And then we’ll focus our attention in the performance of 2023 between Arbitrum and Optimism
Methodology
Images: Arbitrum vs Optimism, Twitter is a Screenshot of the tweet.
Using FlipsideCrypto Data
(optimism/ethereum/arbitrum).core.fact_transactionsto get most of the data with:tx_hash: To get the transactionsfrom_address: To get the UsersGas_Used: to get the gasTX_FEE: To get the $ETH Transaction FeeETH_VALUE: To get the $ETH Volume in the transaction.To_address: If we join this value with theAddress from (optimism/arbitrum).core.dim_labelswe can get information about the favorite Dapps.
- All blockchains have the same colums name so is very easy to explain the methodology some extra insights:
-
sum(case when Status='SUCCESS' then ETH_VALUE else 0 end)we can get the ETH_VALUE correct coming from only successful transactions.- Failed Transactions spent Gas and $ETH Fee By the way
-
sum(case when status= 'SUCCESS' then 1 else 0 end)we can get the Successful Transactions and with this also the failed (you need to change your case only)\
-
Arbitrum + Optimism vs Ethereum - Analysis
The Activity for the L2-Chains starts to go in a uptrend at the last months of 2022, and as expected their total gas usage is bigger than Ethereum, achieving their goal of saving Ethereum Gas per transaction.
- Transaction Fees are really lower for these L2-Blockchains and they spent less than 4% of the total Fees compared to Ethereum since June 29 when the $ETH in Fees for the L2 Reached their highest percentage of 7.77%
- $ETH Transaction Volume doesn’t increase over time and only have certain periods where they reach high numbers such as the FTX Crash (Nov 9) or the Terra Crash (May 12) for Ethereum, in the Case of Arbitrum and Optimism their spikes are located in other days such as September 6, 17 and 19
- September a Month with high $ETH for L2-Chains.
- Transactions and Users increase over time, although the amount of users in Ethereum is really high more unique users are reaching these L2-Chains in 2023, meanwhile transactions these L2-Chains already beat Ethereum since November, and hopefully they can end January 2023 as the first month with more daily transactions than Ethereum.
👀 Here is the ==Flippening== 👀
The Flippening started in 2022 in November 5!
- Days when Arbitrum + Optimism Transactions Beat Ethereum:
- November 2022 (13 Days) Longest Streak (6 Days from November 19 Until November 24):
- 5-6, 8-9, 19-24, 26-27, 30
- December 2022 (14 Days) Longest Streak (3 Days in 3 differents Periods)
- 3-4, 8, 14-15, 20-22, 24-26, 28-30
- January 2023 (13 Days) Longest Streak (9 Days from January 9 Until January 17)
- 3-4. 6-7, 9-17
- November 2022 (13 Days) Longest Streak (6 Days from November 19 Until November 24):
- Arbitrum and Optimism started their percentage difference with the lowest value of 8.8% in April 18
- In July 10 they reached again another valley with 9,06% but after that their activity only increased.
Transaction Volume What it is?
Every Transaction have an ETH_VALUE and indicates if they’re making a transaction with $ETH involved in this case we only considered Successful Transactions.
- Because Failed Transactions doesn’t move $ETH and look at some examples of why not including these kind of transactions - #1, #2, #3, #4
- These TX are in the top 10 by
ETH_VALUEin Arbitrum and it messes with the data because theETH_VALUEwas never moved.
- These TX are in the top 10 by
It’s seems that in the past days the amount of $ETH involved was less than 2022.
- In September 7 the Amount of $ETH reached the spike for Arbitrum + Optimism with 25.6% that is in $ETH:
- 775,223 (Arbitrum+Optimism) vs 2,244,118 (Ethereum).
December 2022 have the last spikes with 22% in December 3 for Arb+Opt vs Eth
🔎$ETH Tx Volume Analysis🔍
Arbitrum have a higher $ETH Volume than Optimism by far.
- Growth Rate in Arbitrum is higher reaching higher Spikes than Optimism.
- In less than 8 days Arbitrum reached 218k in $ETH Volume meanwhile Optimism take 19 Days to reach 219k $ETH Volume
- Arbitrum favorite Dapps in $ETH Volume are Uniswap, with almost 90% of the $ETH Volume, Binance with 6.2% and Bybit with 4.24%.
- Again only 3 Dapps rise into the top.
- Optimism favorite Dapps are Binance with 44.3%, KyberSwap with 17.5% and Uniswap with 14.4%, the rest of Dapps present less than 10% of the total $ETH Volume
Dapps $ETH Volume and total $ETH Volume aren’t the same specially for Arbitrum so there a lot of unlabeled Projects receiving $ETH in Arbitrum
Also Uniswap $ETH Volume is the same (19,271.35851) in Both Blockchains
🔎Transaction Analysis🔍
Activity in both chains are practically the same having almost the same number of transactions in 2023, Optimism was in the lead until January 18 Onwards where TX Activity from Arbitrum beat Optimism, but this is because Optimism activity drastically lowered.
- Optimism have the biggest Negative Growth Rate
- Fail Rate for Arbitrum is bigger but after January 19 Optimism Fail Rate increase considerably.
- Arbitrum TPS ranges between 3.5-7.1 Meanwhile Optimism Between 2.2-9.2
- Optimism TPS Was bigger since January 5 until January 17
- Arbitrum TPU ranges between 8.6-12.5 Meanwhile Optimism Between 5.3-11.43
- Most Transaction Activity in Arbitrum comes from DeFi Apps or Bridges with Uniswap in the lead followed by Hop Protocol and Aave
- The rest of the Dapps doesn’t have any relevance in comparison with the top 3
- Most Transaction Activity in Optimism comes from Bridges and DeFi with Hop Protocol leading followed by Project Galaxy and Uniswap.
- The Transaction per Dapp is very balanced in Optimism in Comparison with Arbitrum
🔎User Analysis🔍
In most of January days there were more Optimism users than Arbitrum, but after January 17 Optimism users decrease considerably moment where Arbitrum takes lead in January 19.
- January 7 was the day with most users for both blockchains
- The Cumulative Amount of New users of Arbitrum never Beats the Cumulative Amount of Optimism.
- But they’re very close each day.
- The New User Percentage (NU%) was high in Optimism but after January 11 this amount starts downtrending, Arbitrum NU% Starts downtrending after January 15.
- Optimism Growth Rate for New Users have more days in the Negative numbers in comparison with Arbitrum.
- Most User Activity in Arbitrum comes from DeFi Apps or Bridges with Uniswap in the lead followed by Hop Protocol and Aave
- Again the Rest of Dapps doesn’t have relevance in comparison with the top 3
- Most User Activity in Optimism comes from Bridges and DeFi with Hop Protocol leading followed by Project Galaxy and Uniswap.
- User Activity in Optimism is very balanced on differents Dapps
Both Blockchains present almost similar number in Users
🔎Tx Fees + Average Gas Analysis🔍
Although Both chains have the same amount of Transactions the Fees in Optimism are more expensive than Arbitrum
- Growth rate of TX Fees is very similar in both blockchains but in January 17-19 this correlation breaks with Optimism Having a massive downtrend.
- Average Gas is higher in Arbitrum most of the days but after January 18 the average increases for Optimism.
It’s seems that Arbitrum have Cheaper $ETH Fees per Gas than Optimism
Summary
It’s seems that the Flippening happened before announced and just days before the FTX Crash in November 5.
- Since November the amount of Flippening days in transactions seems to be increasing and January 2023 is the month with the longest streak (9 Days) and the first month that will reach more than half of the days with Arbitrum + Optimism having more transactions against Ethereum.
- These L2-Chains fulfill their objective saving Ethereum Gas by spending their own Gas, and the amount is really high.
- Because Arbitrum runs in their own virtual machine (AVM) Their $ETH Transaction fees are lower than Optimism running in the EVM.
- We can see that both Arbitrum and Optimism Activity is really Similar, specially in Transactions, Users and Gas Usage
- Optimism is going for critical days lately having less activity and Arbitrum beating Optimism.
- $ETH Volume in Arbitrum is higher by far than Optimism, and looking at the top DApps in Arbitrum it’s seems that User Usage of Arbitrum is related more to Decentralized Finances applications such Uniswap and Bridge Activity from Hop Protocol.
- Meanwhile User Usage in Optimism is very balanced with differents project being used by users with Uniswap in the Top also.
By far people sees Arbitrum as good place to Swaps token because of the cheaper $ETH Fees, and Optimism activity is higher in differents app thanks to strategies such as the launch of $OP and airdrops to differents DApps.
In both Cases Uniswap is the king of DeFi and Binance the Favorite App to send their $ETH Volume
Made by Popex404 - Twitter Link Here