💲 Price effect ✍️
The dashboard is being used to analyze or study how users on the Ethereum network responded or reacted to a specific event. The dashboard contains data, charts, and information that provide insights into how users behaviors, activities, changed in response to this particular event .
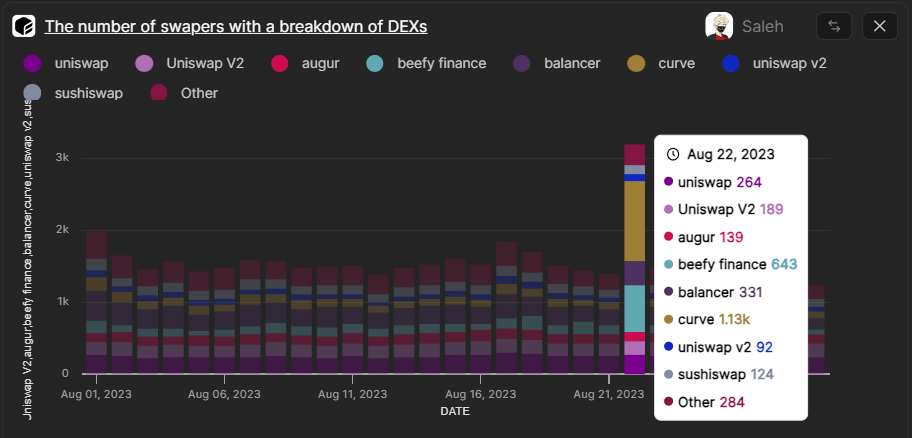
As we delve into the records of August 22, 2023, within the domain of Curve finance, a conspicuous surge in the number of swappers comes to the forefront. Within the intricate framework of this financial landscape, a particular dashboard tab stands resolute, meticulously dissecting and deciphering an array of statistics and behavioral patterns exhibited by these swappers.
The events of this pivotal day cast a spotlight on the remarkable upswing in swapper activity, marking a significant juncture within the dynamic realm of Curve finance. This surge, characterized by an influx of individuals engaging in swapping activities, has instigated a ripple effect that resonates throughout the ecosystem.
Nestled within the architecture of this financial platform, a dedicated dashboard tab emerges as the analytical epicenter, an interface meticulously designed to meticulously unravel and scrutinize the multifaceted facets of swapper behavior. This digital observatory functions as a sentinel of sorts, meticulously tracking and interpreting every nuance of the swappers' actions, shedding light on the underlying motivations, trends, and propensities that define their engagement within the Curve finance landscape.
As the digital tapestry of this eventful day continues to unfurl, the dashboard's intricate analytics play a pivotal role in unraveling the enigma of this swapper surge. With an amalgamation of visual representations, statistical breakdowns, and behavioral insights, this analytical tab becomes a compass, guiding both seasoned analysts and curious observers through the labyrinthine corridors of swapper activities.
In conclusion, the annals of August 22, 2023, etch an indelible mark within Curve finance history, as the surge in swapper activity takes center stage. At the heart of this phenomenon lies the dashboard tab, an invaluable tool that meticulously collates, dissects, and interprets the rich tapestry of statistics and behavioral cues exhibited by these swappers. This convergence of technology and finance underscores the ever-evolving landscape of digital economics, where insights gleaned from data pave the way for informed decisions and a deeper understanding of market dynamics.
🚀 On August 23, 2023, Curve Finance experienced an exceptional surge in swapper activity, revealing moments of intense engagement and trading frenzy.
Highlight Moments:
⏰ 9:00 AM - The Peak Hour The most remarkable hour of the day was undoubtedly the 9th hour, where swapper activity reached its zenith. During this hour, the 9th minute stood out as a true spectacle, witnessing a whopping 50 swappers actively participating in swapping.
Reasons Behind the Surge:
🌐 Global Market Impact The cryptocurrency market operates 24/7 across different time zones. This 9 AM surge might reflect the transition of trading activities from various parts of the world, leading to a collective wave of participation.
📢 Market News and Volatility The frenzy might be attributed to market-opening buzz or impactful news that shook the crypto space. Heightened price volatility often prompts traders to act quickly to seize opportunities.
🔄 Arbitrage and Volatility Play Swappers might have sought to exploit price variations between platforms. The surge could signify a strategic move to capitalize on quick price fluctuations.
💰 Yield Farming Buzz Curve Finance's liquidity pools and yield farming incentives might have been adjusted, causing a rush as traders aimed to maximize their yields.
📈 Strategic Trading The minute-by-minute nature of crypto trading encourages traders to time their moves strategically. The 9th minute's peak could be a result of coordinated trading strategies.
🌎 Global Influences External events, regulatory developments, or social media trends could have ignited interest worldwide, leading to a synchronized uptick in trading activity.
Key Takeaway:
📈 The 9th hour, specifically the 9th minute, emerged as the crown jewel of swapper activity on August 23, 2023. The flurry of engagement underscores the dynamic nature of the crypto market, where traders respond swiftly to opportunities driven by market dynamics, global influences, and strategic trading decisions.
🔍 To unravel the precise factors fueling this surge, it's crucial to consider the broader market landscape and any significant events that transpired during this high-intensity period.
🌟 WETH=>stETH Pair (1st Place):
The "WETH=>stETH" pair takes the lead with the highest number of swappers (1018) and the second-highest total swap value ($17,583,018.24). This pair involves Ethereum (WETH) and staked Ethereum (stETH), indicating active trading between these two forms of ETH. The large number of swappers suggests a high demand for swapping between these two assets, possibly driven by various trading strategies, yield farming, or rebalancing activities.
🌟 stETH=>WETH Pair (2nd Place):
The "stETH=>WETH" pair follows closely with 103 swaps and 25 swappers, but it has the highest total swap value ($19,297,647.33) among the top three. This pair represents the opposite direction of the first pair, where staked Ethereum is converted back to regular Ethereum. The relatively lower number of swappers might indicate that staking to stETH is a popular activity, with fewer users unstaking to WETH.
🌟 WETH=>USDT Pair (3rd Place):
The "WETH=>USDT" pair secures the third position with 113 swaps and 23 swappers. Its total swap value of $6,146,090.35 shows consistent trading activity. This pair involves swapping Ethereum to USDT, a stablecoin, possibly indicating profit-taking, hedging against volatility, or preparing for other transactions within the Ethereum ecosystem.
Overall Insights:
The top three trading pairs exemplify a diverse set of trading strategies and user behaviors. The first two pairs highlight significant interest in ETH and stETH trading, while the third pair reflects the use of stablecoins for various purposes. The substantial number of swappers and the considerable total swap values of these pairs underscore the dynamic and active nature of the Curve Finance ecosystem on August 22, 2023.
🔄 Moving Average Impact:
- The 7-day moving average offers a more stabilized view of trends over time.
- It ranges between 78,520 and 139,033 USD.
- This moving average might indicate general market activity levels.
🔗 Relationships:
- Higher moving averages might imply increased trading interest, potentially influencing swap rates.
- Yet, external factors (sentiment, news, token prices) also impact swap rates.
In summary, the data's fluctuating nature highlights the importance of the 7-day moving average in providing a smoothed trend.