Liquidity Pools - Wallet Composition
What type of wallets provide liquidity on Osmosis? Is liquidity concentrated and owned by a small number of whales? Or, are there a diverse range of participants in the LP ecosystem? Do LP composition change based on TVL of the pools themselves?
\
Instructions :
Introducing osmo
introducing LP
introducing TVL
What type of wallets provide liquidity on Osmosis?
Is liquidity concentrated and owned by a small number of whales?
are there a diverse range of participants in the LP ecosystem?
Do LP composition change based on TVL of the pools themselves?
Lets dig into it…
> Osmosis is an automated market maker (AMM) protocol built for liquidity providers. Therefore, it should be governed and owned by liquidity providers. Over time, the largest allocation of OSMO tokens is set aside for liquidity incentives to reward liquidity providers for their contributions and give them an ownership stake in the future of the protocol.
Liquidity Providing?
> Providing liquidity (called “LPing”) is the process of depositing assets into an AMM pool. AMMs are decentralized finance protocols that allow for the swapping of assets without a centralized intermediary. Just as trading firms make traditional markets, AMMs establish prices and facilitate trades using permissionless liquidity pools into which users can deposit assets.
>
> For example, if Pool #1 is the OSMO<>ATOM pool, users can deposit OSMO and ATOM tokens into the pool and receive back Pool1 share tokens. These Pool1 share tokens (called LP tokens) represent one’s proportional ownership of the pool.
>
> Liquidity pools have specific ratios at which assets must be deposited. Most AMMs require that assets be added at a 50–50 ratio (the total value of Asset 1 is equal to the total value of Asset 2). Similar to Balancer protocol, Osmosis allows for pools with customized weights (allowing the total value of one asset in the pool to be higher than the other) and even liquidity pools with more than two assets.
>
> Users pay a fee to buy and sell from these liquidity pools. These transaction fees are added to pool assets, essentially resulting in a pro-rata distribution to LP share holders. (Since one’s proportional ownership of the pool remains constant, as the total amount of liquidity in these pools increases due to fees, one’s total contributions also increase.)
>
> Liquidity provision is not without costs. LPs take on a risk known as impermanent loss. It essentially means that users would have earned more simply by holding the assets than depositing them into liquidity pools. When the price of the assets in the pool change at different rates, LPs end up owning larger amounts of the asset that increased less in price (or decreased more in price). For example, if the price of OSMO moons relative to ATOM, LPs in the OSMO-ATOM pool end up with larger portions of the less valuable asset (ATOM).
>
>
>
> Impermanent loss is the difference in net worth between HODLing and LPing. Liquidity mining helps to offset impermanent loss for LPs.
>
> Impermanent loss is mitigated in part by the transaction fees earned by LPs. When the profits made from swap fees outweigh an LP’s impermanent loss, the pool is self-sustainable.
>
> To further offset impermanent loss, particularly in the early stages of a protocol when volatility is high, AMMs utilize liquidity mining rewards. Liquidity rewards bootstrap the ecosystem as usage and fee revenues are still ramping up.
>
> Osmosis also has many new features and innovations in development to decrease impermanent loss as well.
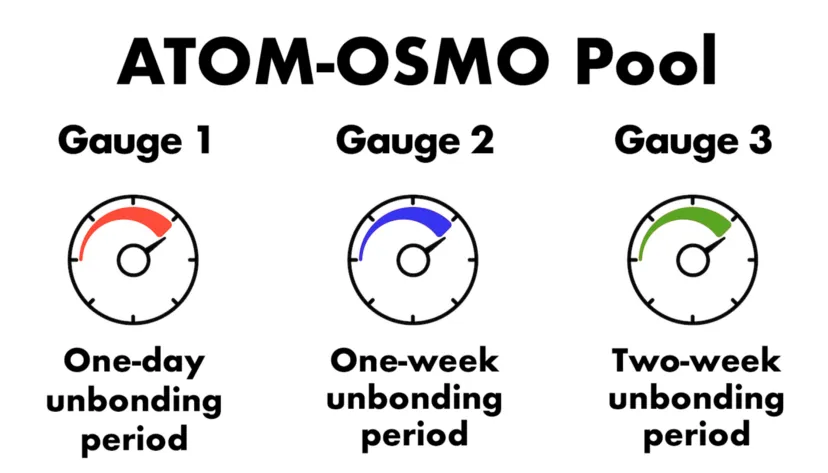

Bonded Liquidity Gauges
> Many AMMs are plagued by short-term mercenary farming, in which liquidity providers quickly remove and add back liquidity from pools in pursuit of the best yields. AMMs sometimes encourage this type of farming through “vampire attacks,” in which a protocol offers special incentives to liquidity providers from other protocols for migrating their liquidity over. > > If enough LPs are engaging in short-term yield strategies, it can cause a serious disruption to the quality of the AMM. Liquidity within pools becomes volatile, resulting in an inconsistent and unreliable trading experience for users. > > Instead, with Osmosis we want to build a platform conducive to Long-Term Liquidity. Osmosis reduces short-term farming through two mechanisms: Exit Fees (a small fee LPs pay when withdrawing liquidity from a pool) and Bonded Liquidity Gauges. > > ==Bonded Liquidity Gauges are mechanisms for distributing liquidity incentives to LP tokens that have been bonded for a minimum amount of time. 45% of the daily issuance of OSMO goes towards these liquidity incentives.== > > Osmosis users can choose to bond their LP tokens after depositing liquidity. Similar to OSMO staking, LP tokens remain bonded for a certain length of time, except users are allowed to choose the length of their own unbonding period. Staking requires a two-week unbonding period. > > When a user wants to stop bonding an LP token, they submit a transaction that begins the unbonding period. After the end of the timer, they can submit another transaction to withdraw the tokens. > > Bonded Liquidity Gauges distribute liquidity incentives to LP tokens with specific bonding lengths. For instance, a `Pool 1 LP share, 1-week` gauge would distribute rewards to users who have bonded Pool1 LP tokens for one week or longer. The amount that each user receives is in proportion to the number of their bonded tokens. > > A bonded LP position can be eligible for multiple gauges. Qualifications for a gauge only involve a minimum bonding time. > > Let’s explore with an example:
Different types of wallets on OSMO:
> according to the chart on the left side of the screen we can see different range of wallets on OSMO. as you see a huge part of this blockchain users are shrimps with 53.2%(1,099,995) users. next we observe 29.6%(611,799) users, which are crabs. the third large number belongs to fish which is 13.1%(271,821)users. the majority of the users shrimps crabs and fishes the rest are dolphins , sharks, whales, and humpback whales with respectedly 2.84%(58,675), 0.531%(10.984), 0.361%(7461), 0.333%(6882). > > \
> due to the chart above we can get more info about number of users by wallet type in date . we see that on jun22 the number is very small but as the days go by and this market grows population starts to grow on dec22 until mar17 which 8001 users are shrimp on that day crabs are some how high with 3161 users but the rest are lower like far lower fishes are acceptable too with 1124 users. then we see a downside until may17 as expected shrimps still have the majority with 6710 and crabs are 2641 users the highest among all. then the descending begins until today.
> 19th day of jun 2021 the markets begins its work. with 2384 transactions not noticeable as you guess but as you saw on the previous chart the start of the increasing users at dec22 the market saw 7229 transactions and the highest amount of transactions belongs to 1st of march with 24.734k tx. > > after that descending begins until may17 with 14.553k and then market goes went on slowly until today.
Different types of wallets on OSMO:
> according to the chart on the left side of the screen we can see different range of wallets on OSMO. as you see a huge part of this blockchain transactions are shrimps with 50.7%(1,814,512) transactions. next we observe 30.2%(1,081,279) transactions, which are crabs. the third large number belongs to fish which is 13.9%(498,332)transactions. the majority of the users shrimps crabs and fishes the rest are dolphins , sharks, whales, and humpback whales with respectedly 3.53%(126,196), 0.736%(26,310), 0.449%(16,043), 0.379%(13,565). > > \
> due to the chart above we can get more info about number of transactions by wallet type in date . we see that on jun22 the number is very small but as the days go by and this market grows population starts to grow on dec22 until mar17 which 12,592 transactions shrimps made on that day crabs are some how high with 6,257 transactions but the rest are lower like far lower fishes are acceptable too with 2,446 transactions. then we see a downside until may17 as expected shrimps still have the majority with 8,790 and crabs are 3,833 transactions the highest among all. then the descending begins until today.
TVL
** \n What does the total value locked mean?**
Since decentralized finance (DeFi) boomed in 2020, financial market experts have come to terms with a new type of investment and have looked at ways to measure its performance.
> Other than market capitalization, trading volume and total and circulating supply, total value locked (TVL) is one crypto indicator that is popular among DeFi investors to assess the overall value of assets – in United States dollar or any fiat currency – deposited across all DeFi protocols or in a single DeFi project. > > DeFi assets include rewards and interest, coming from typical services such as lending, staking and liquidity pools, provided in the form of smart contracts. TVL in staking, for example, is a particularly useful indicator for investors looking to support the DeFi platforms with the highest rewards. It is the total value locked in the DeFi staking protocols and represents the amount of assets deposited by the liquidity providers. > > In 2022, TVL has reached nearly $2 billion globally, growing from $400 million in the previous two years. With the increasing popularity and value of DeFi in the cryptocurrency space, TVL has become an essential metric for investors who want to assess if the whole ecosystem or a single protocol is healthy and worth investing in. > > While TVL is simply defined as the total value of cryptocurrency locked in a smart contract, there are underlying conditions that may affect the value of DeFi projects. > > Various elements concur on TVL’s worth other than deposits, withdrawals and the amount a protocol is actually holding. The TVL also changes with the value of the fiat currency or the native token. Some protocols’ deposits may be denominated in the project’s native token, so its TVL varies with its value. If a specific token grows in value, so does the protocol’s TVL, too.
** \n Why does TVL matter in DeFi?**
> For DeFi platforms to function, they require capital to be deposited as loan collateral or liquidity in trading pools. TVL matters because it indicates the capital’s impact on DeFi applications’ profits and usability for traders and investors. > > When the TVL of a DeFi platform rises, it is followed by an increase of liquidity, popularity and usability. These factors contribute to the project’s success. A higher TVL means more capital is locked in DeFi protocols, with participants enjoying more considerable benefits and proceeds. A lower TVL implies lower availability of money, resulting in lower yields. > > DeFi protocols' market share can be easily identified through analytics firms’ platforms like DeFi Pulse and DefiLlama, which provide data on the amount of crypto assets locked in their respective smart contracts. > > DeFi participants who track down TVL on DeFi Pulse must know that the platform monitors protocols’ smart contract movements on the Ethereum blockchain only by extracting the total balance of Ether (ETH) and ERC-20 tokens. DefiLlama, on the other hand, calculates the TVL by extracting the total balance of all of the DeFi chains combined or each individual platform separately.
How is crypto TVL calculated?
Due to ceaseless new protocols emerging in the DeFi space, it may be challenging to establish the exact TVL of the overall market and determine if a specific DeFi platform is a safe option for end-users.
However, participants can opt for more established protocols using a TVL metric of $1 billion, which should be a secure enough prospect. A higher TVL is better, as it should indicate a healthy platform in high demand with a strong developers team and a valuable use case. All of which should attract more participants and investors, contributing to the project’s rise of the TVL.
On the other hand, a red alert should be raised when DeFi protocols with lower TVL are offering high yields. These might well be promotions, for example, for new platforms that want to gain market shares, but could also be scams because little or no participants have trusted them with their assets.
Three main factors are considered to calculate a DeFi protocol’s TVL:

It is straightforward to calculate the crypto TVL. First, the market cap of an asset has to be found by multiplying the DeFi project’s supply by the current price. Then, dividing the market cap by the maximum circulating supply, the TVL is revealed.
When dividing the total market cap of a locked asset by the total value locked, we obtain the TVL ratio. The TVL ratio can help determine if a DeFi asset is undervalued or overvalued. If the ratio is under 1, the asset is usually undervalued and more attractive to investors. When the market cap exceeds the TVL in crypto, the asset might be overvalued, leaving little to no room for growth.
> in the chart above it is witnessed that at the beginning the transactions took place not bad with the number of 1321 tx. while the TVL was 11.88783m. but at the 4th of jan the market pumped up with 2578 transactions and 64.19166m Osmo locked in the blockchain and the highest transaction value happened on 1st of march which was 7993 TXs and 180,8912m OSMOs locked . and then the market started to decrease on transactions but still TVL was high maybe its because the TVL pool period was for 6 months.
on the other part we can observe the number of users by date..
March first was the best day of the market with 6576 users of 180.8912m as you see the other parts of the chart we cant see any other good day like that there are less ups but many downs like oct 25 2022 with just 26 users which shows people only trust big markets like bitcoin and Ethereum.
conclusion
- Users with the attribute of shrimps are still the most consumed with 6710 and crabs with 2641.
- Observe the downward trend in transactions from May 17 to today
- Naturally, amber whales, while having the least number of wallets, also have the most transactions.
- Shrimps are still the majority with 8,790 transactions and crabs are the highest of all transactions with 3,833 transactions.
- Being high on tvl even when the market took a bearish shape
- The maximum number of users was on March 1st, and if we put all the images together in the same way, it is one of the best in the market on March 1st.
- The lack of trust in small markets can be observed relatively, which can be the cause of trust in larger markets such as Ethereum.