Solana - Network Performance

Solana Performance Metrics
> Solana cluster performance is measured as average number of transactions per second that the network can sustain (TPS). And, how long it takes for a transaction to be confirmed by super majority of the cluster (Confirmation Time). > > Each cluster node maintains various counters that are incremented on certain events. These counters are periodically uploaded to a cloud based database. Solana's metrics dashboard fetches these counters, and computes the performance metrics and displays it on the dashboard. → Source
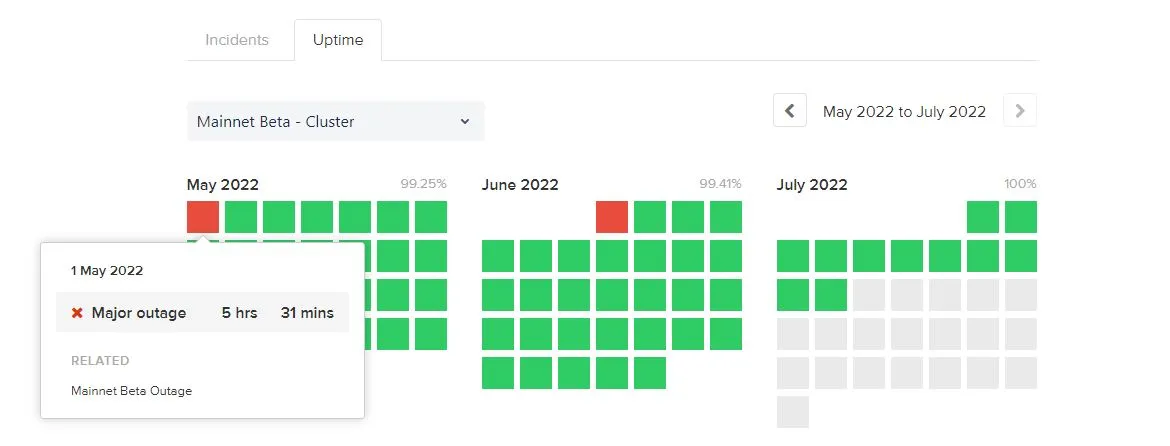
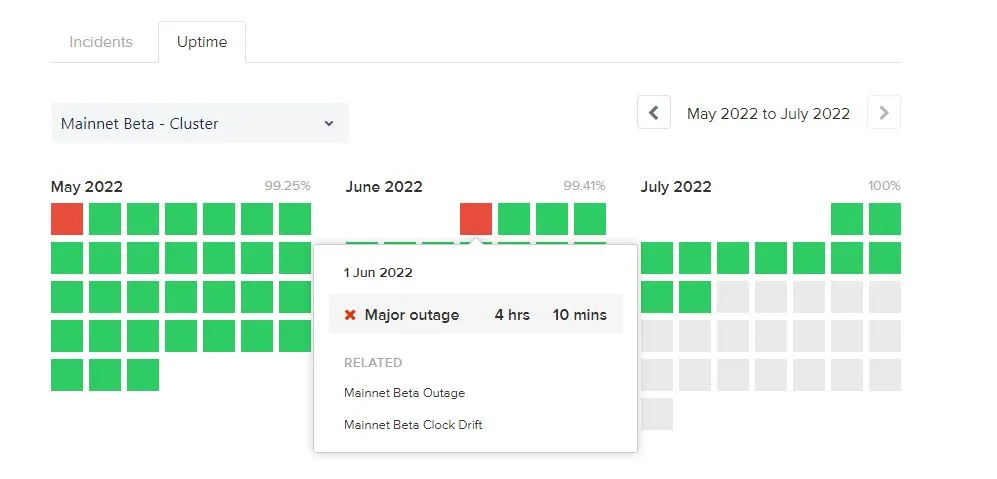
Solana has experienced two ==Major Outages== in the last three months, one on May 1 and one on June 1, as shown in the figure below: → Image link
Description of Work
In this bounty, we want to examine the Network Performance in Solana, for this we will compare the Network Performance in the last month with the rest of the year and we want to check whether the Network Performance in Solana has increased or not, and if yes, is it because of less botting or fewer users, or new improvements from the Solana engineers. for this we check the following items:
- Transaction per second and success rates in the past month compared to the rest of the year
- What wallets and programs have paid the most in fees for failed transactions?
Note
-
We use the solana.core schema and fact_transactions table
-
To address this question, we first get the TPS (Transaction per Second) for the last month and the rest of the year, then we determine how many of these transactions were done by the bot and how many of them were done by normal users, then we compare the success rates for these transactions. Then We will check whether the success rates have increased this month and if it has increased, we will check to see if this increase is because the less botting or fewer users, or new improvements from the Solana engineers
Bot address: Bot address is detected when it has more than 15 to 20 transaction per minute
Method
- TPS: According to the definition of this link, we consider TSP as the average number of transactions in a certain time period. For this part, we consider two time periods: 1- The last 30 days, 2- The rest of the year, then we get the total number of transactions for all seconds of these two time periods, then we calculate their average
- Success Rate: For this section, we get the total transactions and the transactions that were successful, then we calculate its rate (%):
(total success transactions / total transactions) * 100 as success_rate
We get all the calculations based on the time period of seconds, then we calculate their average and rate
- date_trunc('second', block_timestamp) as seconds
Conclusion of part 1
-
TPS past month is 694 while for the rest of the year it was 550
-
Success Rate past month is 69.4% while for the rest of the year it was 72.3
-
The ==Success Rate== has decreased by about ==3%== in the last month compared to the rest of the year
-
The TPS== has increased by about ==20.74%== in the last month compared to the whole rest of the year
Conclusion of part 2
-
From April 10, the number of transactions is increasing daily
-
The number of daily transactions is increasing in the last month
-
The number of Success transactions is increasing daily from Apr 10, but the Failed transactions show almost a constant trend.
-
The number of Normal Users is decreasing daily since June 8 (last month), but not a significant decrease, while the number of Bots shows a steady trend and we do not see a significant decrease or increase.
Conclusion of part 3
-
The program pyth oracle has the highest fee paid for failed transactions with 3190.88002 SOL Fee paid, followed by serum dex v3 with 1941.843785 SOL and Jupiter aggregator v2 with 1662.207885 SOL are next.
-
Wallet address 5AmZM5qY2LZtBMVSTVzyZmUGFCgiMTD9xaRuLF8XF1hK has the highest fee paid for failed transactions with 783.006395 SOL Fee paid, followed by CuieVDEDtLo7FypA9SbLM9saXFdb1dsshEkyErMqkRQq with 634.579135 SOL and Y2akr3bXHRsqyP1QJtbm9G9N88ZV4t1KfaFeDzKRTfr with 551.627845 SOL are next.
Final Conclusion
Considering that in the last month, TPS has increased compared to the rest of the year, but the Success Rate has decreased by 3%, and the number of transactions is increasing, and the number of Bots has not changed significantly, and the number of Normal Users is decreasing (but not a significant decrease) it can be concluded that an important part of the increase in TPS is related to new improvements from the Solana engineers and a small part is related to the fewer users. Also the decrease of 3% success rate can be related to the small increase in the number of bots in July 1, 12.6k unique bots have made transactions on this day