Open Analytics Bounty: ETH (November 20)
Open analytics bounties are all about deep dive dashboards into one specific topic.
starter
In this dashboard,I will review the following:
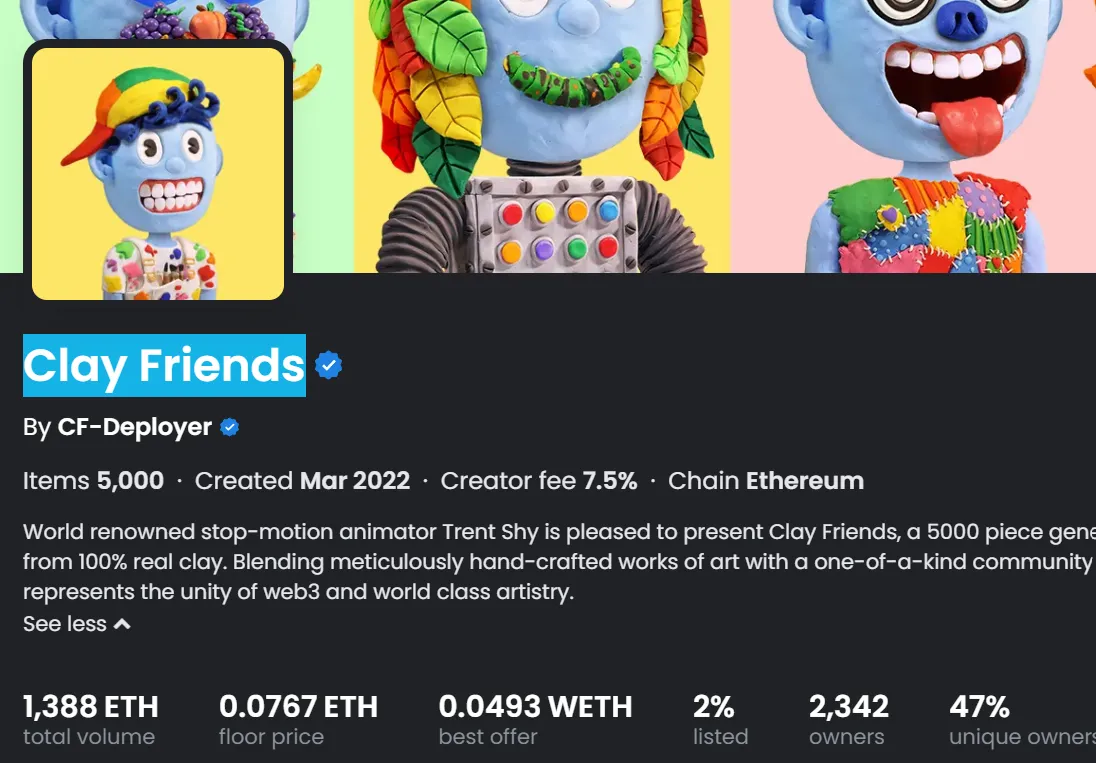
In this dashboard ,i chose to check the clay frinds NFT collection Since the beginning of the ‘2021-01-01’
- introduction to collection clay frinds
- in terms of metrics such as:
- Total Mint & Minter / Daily
- total volume
- total buyer & seller
- minimum & maximum & avg Price
- top 6 NFT highest
- platform cheking
- Daily review of changes NFT
- the Price distribution NFT
Method
- Used
ethereum.core.ez_nft_sales - and
ethereum.core.dim_labels - and
ethereum.core.ez_nft_mints- clay friends
- total volume
- total buyer & seller
- Total Mint & Minter
- minimum & maximum & avg Price clay friends NFT
- top10 NFT highest & lowest Price
- platform cheking
- Daily review of changes NFT
- the Price distribution NFT
- clay friends
About the project
World renown stop-motion animator Trent Shy is pleased to present Clay Friends, a 5000 piece generative collection made from 100% real clay. Blending meticulously hand-crafted works of art with a one-of-a-kind community experience, Clay Friends represents the unity of web3 and world class artistry.
About the Artist
Hailing from Charleston, South Carolina, Trent Shy is a self-taught stop-motion animator widely considered a leading expert in his art form. Trent has a loyal following on social media platforms with almost 1 million followers and over 250 million views across Tik-Tok, YouTube, Instagram, and Twitter. Having worked with notable brands such as New Balance, MTV, Bleacher Report, Trent is no stranger to corporate partnerships and how to navigate them. In his free time, Trent is passionate about spending time with his wife Liz and hitting the trails on his mountain bike.
> ## Observations > > * In the charts above, I have gotten a general idea of clay frinds collection since the start > > total sales volume ETH =1348 ETH total number of NFT = 3650 total buyers =2950 total sellers = 4380 total transaction = 6110 total volume fee =83.5ETH maximum price = 3.5ETH minimum price = 10 m ETH > > average price = 0.2 ETH > > \

> Observations > > * The graph on the left is related to the number of NFT buyers and sellers daily basis. > * As can be seen, this trend was decreasing. > * the number of Sellers was more than the number of buyers on most days. > > The largest number of buyers and sellers were in the first ten days of the project > * the highest number of buyers was on march 4th / 795 Buyers > * the highest number of sellers was on march 4th/ 991 sellers > >
> > > * The graph on the left is related to the number of NFT sales daily basis. > * As can be seen, this trend was decreasing. > > The largest number of NFT sales were in the first ten days of the project > * The highest amount of sales is on march 5th with the number of 1038 NFTs.
> * The graph on the left is related to the volume of NFT sales daily basis. > * As can be seen, this trend was decreasing. > * The highest volume of sales is on March 4th with a volume of 332 ETH. > * Over time, the daily sales volume has decreased, from 332 ETH per day to less than 0.1 ETH.
> * The graph on the left is related to the average , median , maximum selling price of NFT since the beginning of the project, as it can be seen that with the passage of time, we see a decrease in the price of NFT. > * So that the highest selling price of NFT is on the fourth day of sale to date. On March 7, the price was 3.5 Ethereum.
> * The graph on the left is related to the volume of NFT payment FEE since the beginning of the start on a daily basis. > * As you can see, this payment FEE process has been decreasing. > * The highest volume of payment FEE is on march 4th with a volume of 37 ETH
Observations
> * The charts in this section are related to Mint NFT. > As you can see, all the mints were done in two days on March 4 and 5. > The number of mints and minters done on the first day is twice as much as on the second day. > * Number of mint NFT First day = 3414 second day = 1586 total nft mint = 5000 nft > * Number of mint count First day = 3234 second day = 1455 total TX mint = 4690 TX mint > * Number of minter NFT First day = 3229 second day = 1323 total minter = 4420 Minter
> ## Observation
>
> * The chart above from the right is of the top 6 NFTs in terms of the highest price.
> * First Rank is 2418 & 4622 ID with 3.5 ETH
> * second Rank is 1113 ID with 3.29 ETH
> * third Rank is 4023 ID with 2.99 ETH
> * The chart above is the middle of the top ten NFTs in terms of trading volume Note, NFT, ID 2418 with 13.6 K USD had the highest price, also had the highest volume of sales at the same time.
> * The upper left graph is related to the top NFTs in term s of the number of times of buying and selling.
> * the top ten NFTs are the same with six trades
>
>
> * In the four percentage charts , we see platforms checking for clay freinds
>
> As you can see, the largest platform in all fields, both in terms of the number of NFTs, in terms of sales and volume of sales, and in terms of the number of sellers and buyers, is as follows. We also see that the Opensea platform is by a very long distance. It is more than other platforms
> * In terms of the number of Buyers and Sellers and the number of NFTs sold looksrare ranks second.
> * Regarding NFT sales volume , looksrare platform ranks second.
Observations
- The bar chart on the left is the average fee payout per platform
- 1.Opensea 13.7 $
- 2.Looksrare 4 $
- 3.Rarible 3.4 $
- 4.X2y2 0.49 $
- 5.blur 0 $
- In the bar charts above, we see the division of NFT selling prices into 3 sectors.
- The highest Volume sales NFT is in the price range of 0.1 to 1 Ethereums With 1216 ETH
- The second rank for Highest Volume sales is between 0 and 0.1 Ethereums With 96 ETH
- The third rank for Highest Volume sales is between 1 and 10 Ethereums With 21 ETH
- The highest Number OF Nft sales is in the price range of 0.1 to 1 Ethereums With 54842 NFT.
- and second rank for highest number of NFT sales is in the price range of 0 to 0.1 Ethereums with 1286 NFT.
- and Third rank for highest number of NFT sales is in the price range of 1 to 10 Ethereums with 9 NFT.
> # conclusion
-
As you can see, all the mints were done in two days on March 4 and 5. The number of mints and minters done on the first day is twice as much as on the second day.
-
total sales volume ETH =1348 ETH total number of NFT = 3650 total buyers =2950 total sellers = 4380 total transaction = 6110 total volume fee =83.5ETH maximum price = 3.5ETH minimum price = 10 m ETH
average price = 0.2 ETH
-
As can be seen, this trend was decreasing.
-
top 6 NFTs in terms of the highest price.
-
First Rank is 2418 & 4622 ID with 3.5 ETH
-
second Rank is 1113 ID with 3.29 ETH
-
third Rank is 4023 ID with 2.99 ETH
-
that the Opensea platform is by a very long distance. It is more than other platforms
\
contact data:
discord : aor67#3352
THANKS >>