Let's Learn Arbitrum!
Let's learn Arbitrum from bridging and how it compares to its competitor!
Introduction to Arbitrum
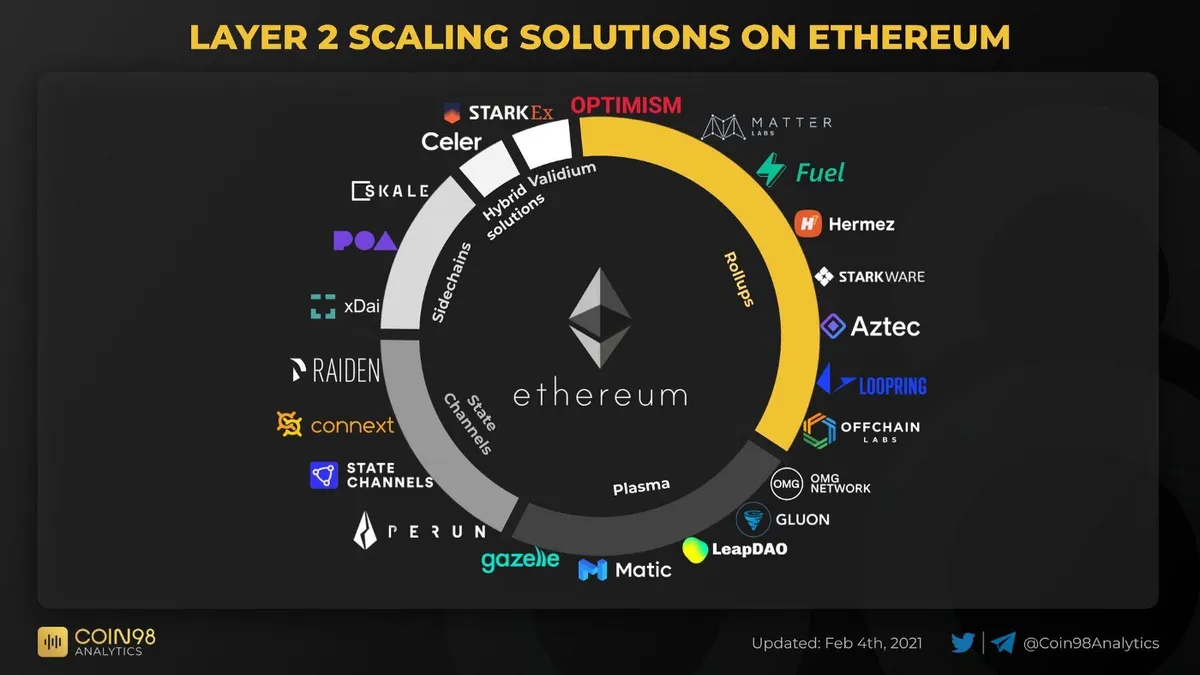
- Arbitrum, like Polygon, Optimism and ZkSync, are Ethereum Layer 2 scaling solutions.
- In the decentralised ecosystem, a Layer 1 network is a blockchain, whereas a Layer 2 protocol is a third-party integration that can be used in conjunction with a Layer 1 blockchain.
- One of the missions is for these Ethereum layer 2 scaling solutions to assist in saving Ethereum from exorbitant transaction fees and alleviating network congestion.
- Layer 2 scaling solutions for Ethereum have the potential to take Ethereum's scalability to the next level.
- The scatter plots above depict the minimum, average, and maximum number of transactions per block on Arbitrum and Optimism.
- The average transaction per Arbitrum block is approximately 1.15, whereas the average transaction per Optimism block is approximately 1. Arbitrum's average transaction per block is approximately 15% higher than that of Optimism.
- Arbitrum's maximum transaction per block is 289, which is approximately 289 times greater than Optimism's maximum transaction per block, which is only 1. This suggests that block size of Optimism is fixed and is much smaller than Arbitrum's.
- The scatter plots above depict the minimum, average, and maximum time between Arbitrum and Optimism blocks.
- The average time between Arbitrum blocks is around 0.94 seconds, whereas the average time between Optimism blocks is around 0.74 seconds.
- We can conclude that Arbitrum blockchain currently has better block and transaction performance than Optimism because it has a higher average transaction per block and a lower time lag between blocks than Optimism.
Daily Active Users on Arbitrum and Optimism
- Daily active users (DAU) are wallets that have performed on-chain transactions on Arbitrum and Optimism and represent the ecosystem's strength.
- Prior to June 28th, the number of daily users on Optimism exceeds the number of daily users on Arbitrum, indicating stronger ecosystem strength.
- However, since June 28th, the daily number of Arbitrum users has surpassed Optimism. This could be because of the Arbitrum Odyssey event which has brought in new users to Arbitrum.
- During Arbitrum Odyssey event, users are rewarded with NFTs for bridging to Arbitrum and performing on-chain tasks on Arbitrum.
- After the first week of Arbitrum Odyssey, we see the daily active users on Optimism exceeding daily active users on Arbitrum for most of the days.
Number of Unique Swappers and Swaps on Arbitrum and Optimism
- The line chart above shows the number of swappers per day on Arbitrum and Optimism since June 15th. These charts include all swap transactions on Arbitrum and Optimism.
- The number of swappers on Arbitrum appears to be higher or equal than on Optimism on most days. Optimism, on the other hand, has a higher number of swaps per day than Arbitrum on most days.
- This shows that the average number of swaps completed by an Optimism swapper is greater than that of an Arbitrum swapper.
- The bar charts above show the wallets transacting USDC and USDC volume transacted on Arbitrum and Optimism per day.
- In this dashboard, transactions are defined as all transactions on-chain excluding swaps.
- We can see that the average number of wallets transacting USDC per day on Arbitrum is approximately 4k, whereas the average number of wallets transacting USDC per day on Optimism is approximately 2k for most of the days.
- Arbitrum has roughly twice the number of wallets transacting USC per day as Optimism.
- Prior to August, Arbitrum's USDC transaction volume is higher than Optimism's on the majority of days. However, since August 1st, we see that Optimism has more USDC transaction volume than Arbitrum on most days.
- Optimism’s USDC transaction volume spiked and peaked on August 4th 2022, with 1.17B USDC volume that day.
- This shows that Optimism has had more transactional activity and wallets transacting in recent days than Arbitrum.
- The above bar graph depicts the number of USDC swappers and USDC volume swapped on Arbitrum and Optimism per day.
- The number of USDC swappers on Arbitrum and Optimism is nearly equal on most days. This changes since June 28th, when the number of swappers on Arbitrum highly exceeded the number of swappers on Optimism per day.
- Prior to 28th June, the USDC swap volume on Arbitrum and Optimism is nearly equal to the number of USDC swappers.
- The increase in swapper count on Arbitrum on July 29th is due to the impact Arbitrum Odyssey Week 2. One of the tasks for week 2 in order to obtain Arbitrum NFT is to complete a swap on GMX, a decentralised perpetual exchange on Arbitrum.
- Despite the fact that Arbitrum has more number of swappers per day, we see volume of swap on Optimism being higher than Arbitrum for majority of the days.
- The above bar chart shows the average USDC swap size on Arbitrum and Optimism (in USDC).
- The average Arbitrum swap size is about 2.127k USDC, while the average Optimism swap size is about 4.04k USDC.
- Optimism's average swap size is greater than Arbitrum’s. This suggests that there are more whales on Optimism.
- This is fitting since in order to complete Arbitrum Odyssey Week 2, users will only have to complete a swap with minimum amount of 10 USD, many participants will just perform the minimum swap amount in order to be eligible for the Week 2 Arbitrum Odyssey NFT.
- The bar charts above show the the distribution of average USDC swap size of Arbitrum and Optimism swappers.
- We can see that the average USDC swap size distribution of Arbitrum wallets is very similar to that of Optimism wallets, with Arbitrum swap size distribution more skewed to the right.
- The vast majority of Arbitrum and Optimism swappers who swapped USDC had an average swap size of 0 to 100 USDC, falling into the Fish category.
- As the category of USDC swap size grows larger, there are fewer swappers in the category for both L2s.
- This is appropriate because swappers can complete swaps even with small USDC sizes (less than 100 USDC) because transaction fees on L2s are generally lower due to less network congestion.
This analysis was created by banbannard
Thank you for taking the time to read this, and I hope you learned something new about Arbitrum!

ETH bridged from L2 to Arbitrum


-
The Arbitrum Odyssey is an eight-week Arbitrum ecosystem event that began on June 21st. It is a weekly event in which users earn rewards in the form of NFTs by completing various tasks and interacting with various protocols on Arbitrum.
-
During the first week of Arbitrum Odyssey, the number of bridging transactions and volume bridged peaked. This is appropriate given that the theme of the first week of the Odyssey was onboarding, and users had a week to bridge ETH assets to Arbitrum using one of the supported bridges.
-
In terms of both the number of bridging transactions and the volume bridged, Hop protocol is the most frequently used bridge by users to bridge from Ethereum and L2s to Arbitrum.
-
Furthermore, there are more bridging transactions from L2s to Arbitrum than from Ethereum to Arbitrum. Nonetheless, the volume bridged from L2s to Arbitrum is significantly lower than the volume bridged from Ethereum to Arbitrum.
-
This implies that the average volume per bridging transaction is lower when moving from L2s to Arbitrum.
Sections in this dashboard
-
Funds Bridged to Arbitrum
- ETH bridged from Ethereum to Arbitrum
- ETH bridged from L2 to Arbitrum
-
Arbitrum vs Optimism
- Block and transaction performance
- Number of swappers and swaps per day
- Wallets transacting USDC and USDC volume transacted per day
- Number of USDC swappers and USDC volume swapped per day
- Average USDC swap size and distribution of average swap size of swappers.
Approach
- Daily active user is defined as wallets that have performed on-chain transactions on Ethereum and Optimism.
- Swaps are defined as
tx_idwithevent_name=Swapon thefact_event_logstables on Flipside. - Analysis in this dashboard starts from June 15th 2022.
ETH bridged from Ethereum to Arbitrum
- Users can bridge their ETH and ERC20 assets to Arbitrum using bridges such as the Multichain, Hop, Debridge, Celer Network, Across and Bungee.
- Credits to Whaen for the query. For more information on Arbitrum bridges, visit his dashboard - Arbitrum Bridges
- Arbitrum vs Optimism
Block and transaction performance
- Funds Bridged to Arbitrum
Number of Wallets Transacting USDC and USDC Transaction Volume on Arbitrum and Optimism
Number of USDC Swappers and USDC Swap Volume on Arbitrum and Optimism
Average USDC Swap Size and Swap Size Distribution on Arbitrum and Optimism