49. Node RUNE in/outflows
In this dashboard, we will take a look at some stats regarding the $RUNE inflows (bought) and outflow (sold) by node operators and compare the volume before and after the emission curve.
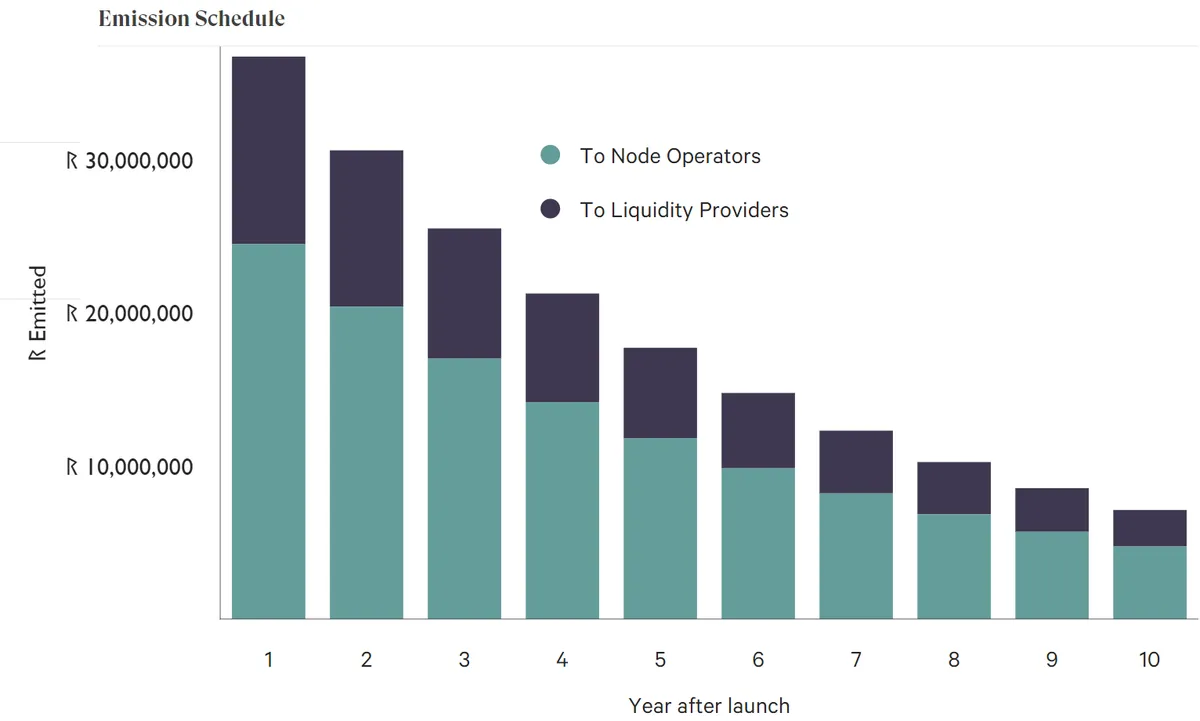
First of all, what is even emission curve. So emission curve is the amount of $RUNE emitted as rewards to node operator and liquidity providers every year. From picture below, we can see that the rewards decreases every year. We also need to know that node operators are the individual/institution that run the network software. In order to become node operator, one must bond 1M of $RUNE to earn rewards.
Graph below shows the daily total $RUNE pooled across all pool and bonded by node operators. We can see now that the volume of pooled is almost same as bonded. This is not ideal as it will no longer motivate node operators to NOT do some bad stuff (ie steal your pooled $RUNE) because the pooled value exceed the bonded volume. However, this would need all the node operators to work together and it is unlikely.
Graph below shows daily node operators by their status. Currently, there are 7 active THORnodes and 5 on standby.
OUTFLOWS
Graph below shows the selling volume of $RUNE before vs after emission curve change. This shows the selling of $RUNE rewards received by THORnodes addresses. We can see that after emission change in early January, the weekly volume of $RUNE sold by THORnodes is much lower compared to week before.
In conclusion, you can imagine the emission curve like the halvening of Bitcoin where rewards was halved after every four years. But for THORChain, emission curve is changed every year. This emission curve cause the amount of $RUNE as rewards to THORnodes lessen thus creating less selling pressure of $RUNE and more buying pressure.
Currently, there are 7 wallets with >1M $RUNE balance, which is accurate to current number of THORnodes.
INFLOWS
With the more scarce $RUNE, let's see if the THORnodes buying more $RUNE or not. Graph below shows that buying pressure by THORnodes continues to increase after emission curve.