Bridge Volume (Hop Protocol)
Q2. How much volume has Hop bridged to Polygon, Optimism, and Arbitrum compared to those protocols’ native bridges? What is Hop’s total TVL? Create an analysis on the Hop’s TVL and how it’s changed over a time period of your choosing.
- There are tons of users on Ethereum that make the blockchain reach capacity limitation.
- The transaction processing demand drives the cost of using the network and increases the waiting period.
- Many off-chain scaling solutions, including L2 (optimism, arbitrum) and side-chain(polygon), were deployed to facilitate the transaction processing.
- Each scaling platform has its own advantages, on the other hand, switching back from L2 or side-chain to L1, then switching to another is not a comfortable way to have all L2 advantages.
This dashboard answer the following question:
- How much volume has Hop bridged to Polygon, Optimism, and Arbitrum compared to those protocols’ native bridges?
- What is Hop’s total TVL?
- How the Hop's TVL is changed over a time period?
Go to Ethereum Scaling for more scaling information.
Go to hop.exchange for more information about hop
- Hop is a way to connect and allow users to send tokens from one rollup or sidechain to another almost immediately without having to wait for the networks challenge period.
- That means you can withdraw your funds from optimistic rollups without the 7-day waiting period.
- Hop supports the transfer of funds including ETH, USDC, MATIC, DAI, and USDT from and to the networks Mainnet, Polygon, Optimism, Arbitrum, and Gnosis.

To clarify the correctness of this information on the dashboard, we list the range of focus as follows:
- If not stated other, we focus on the last 60 days period.
- For an easier query process, we used
WETHto represent the amount of bothWETHandETH. - To be a fair comparison with the hop, we focus only 5 tokens on the native bridge including
WETH,USDC,USDT,MATIC, andDAI. - For conciseness, we consider only bridging from L1 to L2 or side-chain only.
- As discussed in figure 2, the hop bridge amount is only 5.6% from the total bridge amount over the last 60 days.
- Figure 1 shows daily bridge volume based on the platform.
- Each bar in the graph is calculated by adding bride volume to 3 destinations including polygon, optimism, and arbitrum together.
- For each destination, the bridge volume comes from only 5 tokens which hop support including WETH, USDC, USDT, MATIC, and DAI.
- The total highest bridge amount is on May,12 while the volume of the hop is $6.2M from a total of $218.7M on that day.
- The hop bridge amount was lower than 1M for 3 consecutive days from May, 28-30.
- Figure 2 shows the daily total cumulative bridge volume.
- While the total cumulative bridge amount nearly reaches $3B, the hop amount is around $165M.
- The native cumulative bridge amount has some small shoot-ups on April, 29 and May, 12, while the hop cumulative bridge amount gradually grows almost at constant speed.
-
Hop supports four tokens (USDC, USDT, MATIC, DAI) and ETH.
-
While bridging volume of tokens can be extracted from
ethereum.core.fact_token_transfers, the ETH has to be extracted fromethereum.core.fact_transactionsbecause of different function call. -
To convert all bridge volumes to USD, WETH price represents the price and symbol of ETH in this dashboard.
Specific addresses for hop bridge volume extraction
- To extract hop token bridge volume, the address of hop protocol for each corresponding token bridge are listed below
- Hop Protocol: Ethereum Bridge -
0xb8901acb165ed027e32754e0ffe830802919727f - Hop Protocol: USDC Bridge -
0x3666f603cc164936c1b87e207f36beba4ac5f18a - Hop Protocol: USDT Bridge -
0x3e4a3a4796d16c0cd582c382691998f7c06420b6 - Hop Protocol: MATIC Bridge -
0x22b1cbb8d98a01a3b71d034bb899775a76eb1cc2 - Hop Protocol: DAI Bridge -
0x3d4cc8a61c7528fd86c55cfe061a78dcba48edd1
- Hop Protocol: Ethereum Bridge -
- The destination of hop bridge can be decoded from
input_datacolumn ofethereum.core.fact_transactionstable with the sametx_hashas infact_token_transferstable. - The decoded destination chainId are listed below:
- arbitrum - 42161
- optimism - 10
- polygon - 137
Specific addresses for native bridge volume extraction
- To extract native token bridge volume the address of native bridge are listed below:
- for token bridge:
- Arbitrum: L1 Gateway Router -
0x72ce9c846789fdb6fc1f34ac4ad25dd9ef7031ef - optimism: Gateway -
0x99c9fc46f92e8a1c0dec1b1747d010903e884be1 - Polygon (Matic): Bridge -
0xA0c68C638235ee32657e8f720a23ceC1bFc77C77
- Arbitrum: L1 Gateway Router -
- for ETH bridge:
- arbitrum_inbox -
0x4dbd4fc535ac27206064b68ffcf827b0a60bab3f - optimism and polygon are same as token bridge.
- arbitrum_inbox -
- for token bridge:
- Figure 4 shows the number of unique bridge users (bar) and total transaction amount (line)
- The unique bridge users shows the same trends as the transaction amount.
- There is the same proportion as the bridge amount.
- Figure 7 depicts the cumulative arbitrum bridge amount.
- The trend in figure 7 is similar to figure 2 except for the increase in the proportion of hop bridge amount.
- Figure 5 shows the daily total cumulative bridge volume based on destination.
- Each bar in the graph is calculated by cumulative adding bridge volume of hop and native together.
- The bridge destination amount from the highest to lowest are polygon, arbitrum, and optimism respectively.
- The proportion of arbitrum and optimism are almost the same, while the polygon gains more than 70% of the total bridge amount.
- Figure 8 depicts the cumulative optimum bridge amount.
- The optimum cumulative amount is totally different from the rest (Figure 7 and 9) in the way that the bridge amount peak (largest slope) is on June, 1 instead of May, 12.
- Figure 9 depicts the cumulative polygon bridge amount.
- The proportion of hop bridge volume is the smallest among all destinations.
- There is also a peak on May, 12 that same as arbitrum destination.
We can easily further analyze based on tokens bridged by each platform and destination, but for conciseness, we will skip this part in this dashboard.
- At first, hop's TVL contain only USDC.
- USDT was first locked on 2021, July 20.
- MATIC was first locked on 2021, August 6.
- DAI was first locked on 2021, September 14.
- ETH was first locked on 2021, October 1.
- At the peak period (2022, March 28 - Apr 5), the TVL fluctuate around $90M.
- The TVL is on the increasing trend until it reaches the peak at the peak period.
- The TVL has continuously decreased for the last 60 days.
- After ETH joined hop's TVL, it used only 2 months to reach 50% of total TVL for the first time.
- ETH reaches more than 50% for many consecutive days around the peak period (2022, March 28 - Apr 5).
- For the last 60 days, the proportion of ETH decreased from 50 to 30%.
- For the last 60 days, the TVL amount has decreased continuously, while the bridge amount is fluctuate around $500K - $8M.
- We could not find the relation between the bridge amount and the decrease in TVL amount, so we assume that they are not relevant.
- The hop bridge amount is far away lesser than the native bridge amount on the same destinations and tokens.
- The number of unique bridge users shows the same trends as the transaction amount.
- The bridge destination amount from the highest to lowest are polygon, arbitrum, and optimism respectively.
- The optimum cumulative amount is totally different from the arbitram and polygon in the way that the bridge amount peak (largest slope) is on June, 1 instead of May, 12.
- The proportion of hop bridge volume is the smallest among all destinations.
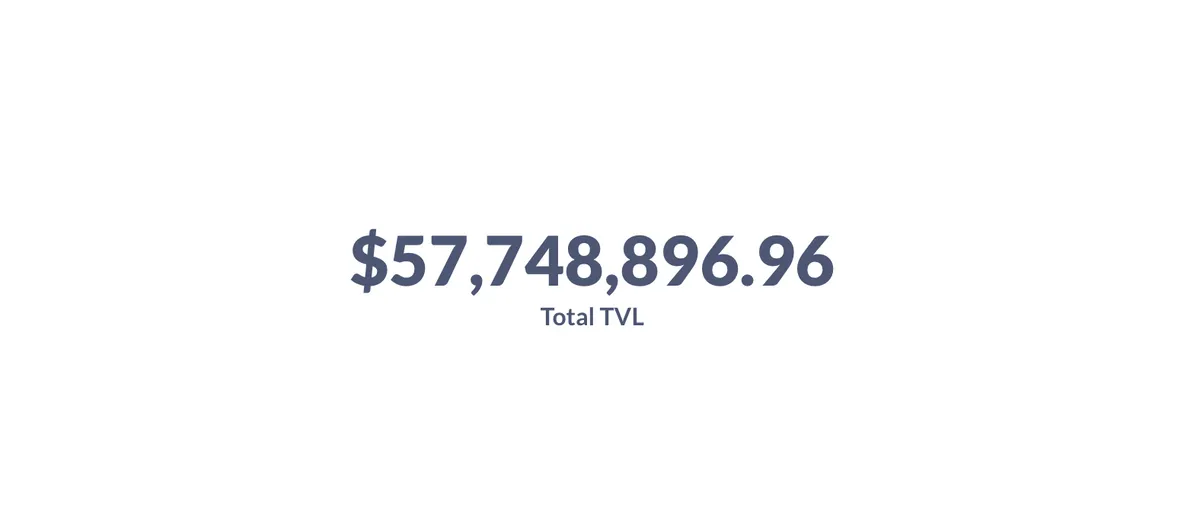
- The total TVL of hop from our method and hop tvl webpage is $39.6M and $57.7M respectively.
- At the peak period (2022, March 28 - Apr 5), the TVL fluctuate around $90M.
- The TVL has continuously decreased for the last 60 days.
- the bridge amount is not relevant to the decrease in TVL amount for the last 60 days.
- Total TVL is extracted from
flipside_prod_db.ethereum.erc20_balancestable using the sum of the current balance on each Hop Protocol Bridges.
From figure 10 and 11:
- Total TVL of hop is around 39.6M USD.
- USDC is the highest bridge amount on hop, while WETH is a runner-up.
- USDC and WETH proportion reach more than 70% of the total TVL.
- MATIC is the smallest bridge amount on hop.
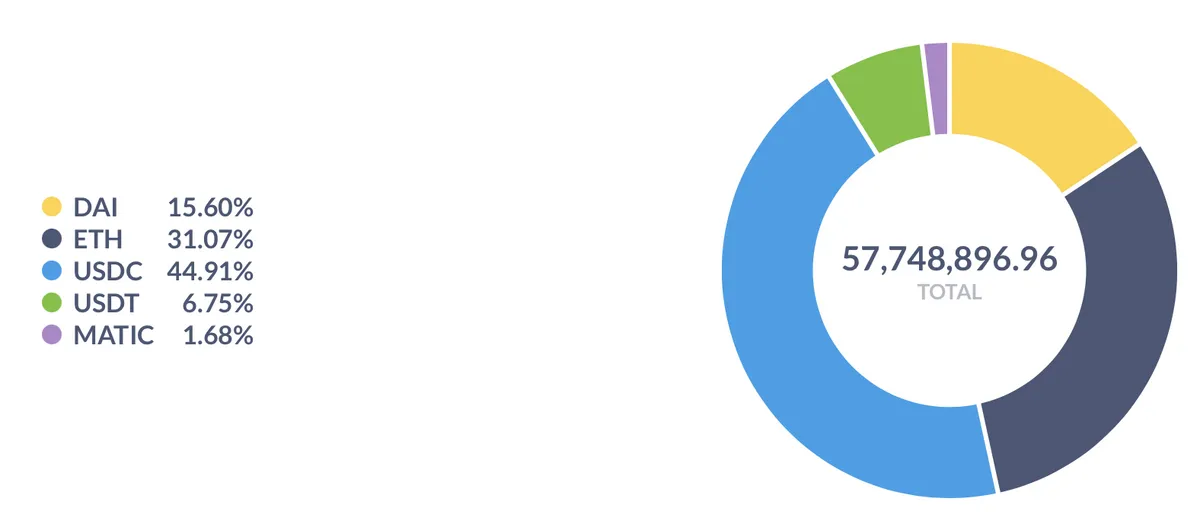
Figure 12: Total TVL from hop webside
- Refer to tvl.hop.exchange, there is a volume gap between the total TVL from our method and the TVL webpage.
- The gap is about $18M.
- If L2 schema is available on the flipside database, it would help to reduce this gap and has more accurate calculation
- Even there is a large gap on the total TVL, the ranks of each token with respect to the TVL amount are the same with small difference on proportion.