Open Analytics - 16. Optimism
In this dashboard, I intend to review Quests NFT collection, which is one of the best NFT collections since the beginning of the new year. And I have investigated the impact of the OP price on this collection.
📌 Overview
- in this dashboard,I will review the following
- In the first stage, a brief introduction to what is Optimism Quests NFT ?
- Total Buyers & Sellers & Average Price
- Total sales Volume & Number NFT
- Top 10 Buyers
- Top 10 Sellers
- Top NFT
- Top USER (Profit )
- Distribution Price
- Analyze each chart
- General conclusion about the dashboard
🔍Introduction
What are Optimism quests?
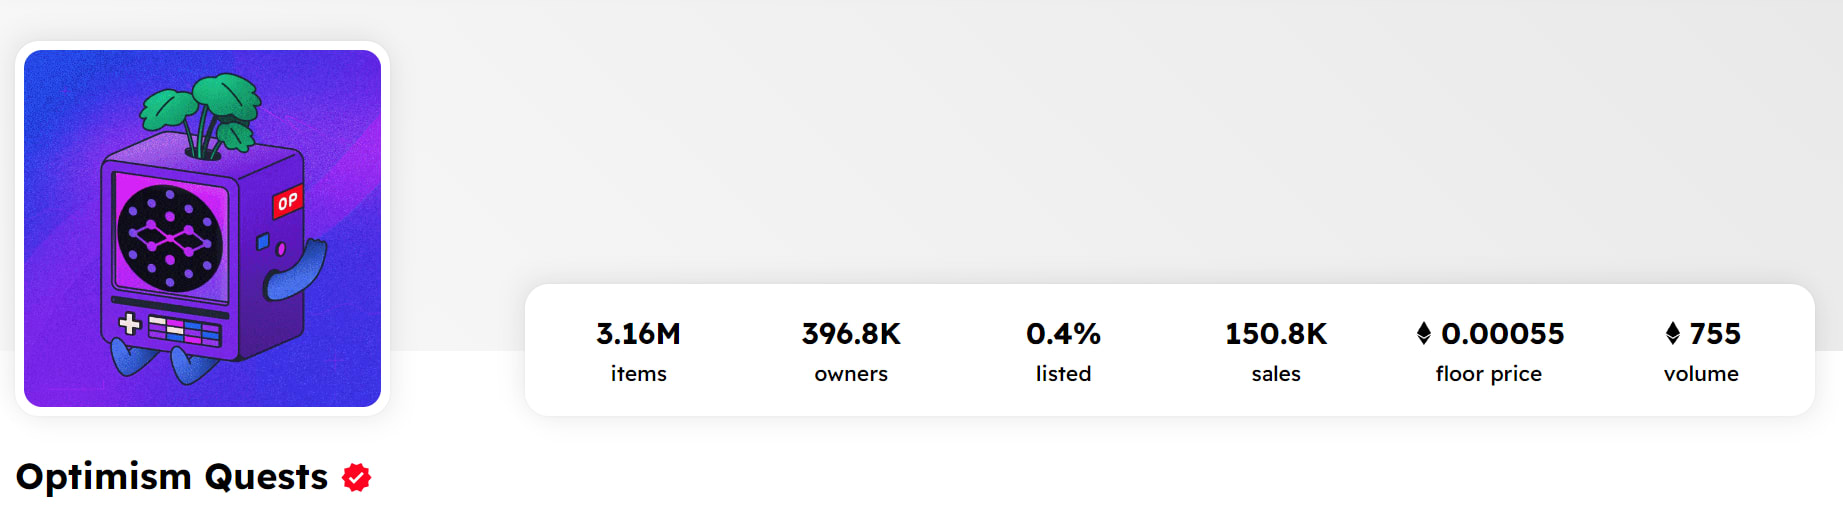
Optimism Quests are a simple, educational, and rewarding exploration of the Optimism app ecosystem. Just by reading about different apps and completing a short quiz and task, users will be able to mint a commemorative NFT that represents the completion of the respective quest.
You can get more details about Optimism Quests from the user perspective here.
Optimism Quests are an event where you can earn NFTs on Galxe by using various projects on Optimism. A total of 18 projects are involved in this campaign.
Why should we do these quests? Holding these NFTs may be one of the criteria to getting the remaining 14% of $OP supply allocated as airdrop to users. (5% have already been airdropped at the end of May 2022.)
How do I get my app added to Optimism Quests?
We’re constantly exploring options to highlight user-friendly apps on Optimism. Over time, we plan to add additional apps in the ecosystem. Please fill out this short form if you would like your app to be featured in future seasons.
In the meantime, companies like Galxe, RabbitHole, AtlantisWorld, and Layer3 can also help you run your own quest!
🖋️ Methodology
- I Used
optimism.core.ez_nft_salesandoptimism.core.dim_labelstables in getting the :- Project Address
0xfa14e1157f35e1dad95dc3f822a9d18c40e360e2- Total Buyers & Sellers & Average Price
- Total sales Volume & Number NFT
- Top 10 Buyers
- Top 10 Sellers
- Top NFT
- Top USER (Profit)
- Distribution Price
- Project Address
📚 Conclusion
> * In terms of the price of the OP, we have seen the growth of the OP since the beginning of the year. > * In terms of all my selected parameters, all parameters have increased since the beginning of the year, but on January 17th, we saw a significant decrease in all parameters (the number of buyers, the number of sellers, the number of NFT sales, the volume of sales, etc.). ) have been > * By further comparing with other collections, almost most of them have seen a decrease in the volume and number of sales since January 17, to some extent, it may be related to the increase in the price of the OP. > > \
> Observation > > * The chart left is of the top 10 NFTs in terms of the highest price. > * First Rank is 1186903 ID with $204 USD > * second Rank is 1154327 ID with $157 USD > * third Rank is 1585960 ID with $153 USD
Observations
- In the bar charts above, we see the division of NFT selling prices into 4 sectors.
- The highest Volume sales NFT is in the price range of 0.01 to 0.05 Ethereums With $114.7 K USD.
- The second rank for Highest Volume sales is between 0 and 0.01 Ethereums With $51.8 K USD
- The highest Number OF Nft sales is in the price range of 0 to 0.01 Ethereums With 40 K NFT.
- and second rank for highest number of NFT sales is in the price range of 0.01 to 0/05 Ethereums with 7626 NFT.
> Observations
-
According to the left data is the top 10 user the most successful traders
-
the First Rank is
0xf605e72938ecda6b1f5d2a754acc470e9f2d51ac with $1974 USD
-
second Rank is
0x91a815025976cc12e6da2dbe5795cfe3691207e0
with $1449 USD
-
Third Rank is
0x4e3da8b358569a826261b5da35efcd65e912b0ed
with $1346USD
-
The most successful trader is the one who has sold the most Number of NFt
> # Observations > > * According to the left data the number of buyers and sellers. > * As you can see, in the beginning, with the passage of time, the number of buyers and sellers Increases, but Then, since January 17th, we have seen a sharp decrease in the number of buyers and sellers. > In general, the number of buyers has always been more than sellers. > * The largest number of buyers on Jan 16th is 1551 and the largest number of sellers is 1455 USER > * total Buyers = 14.01 K > * total Sellers = 11.86 K
> # Observations > > * The graph on the left is related to the number of daily NFT sales since the beginning of the new year, as it can be seen at the beginning of the year, we have seen an increase in the number of NFT sales, then since January 17, we have seen a sharp decrease in sales, in 15 Yesterday we saw a slight increase in the number of sales. The highest number of NFT sales was 4012 NFT on January 17. > >
> > > * The graph on the left is related to the number of daily NFT sales Transactions since the beginning of the new year, as it can be seen at the beginning of the year, we have seen an increase in the number of NFT sales, then since January 17, we have seen a sharp decrease in sales, in 15 Yesterday we saw a slight increase in the number of sales. The highest number of NFT sales was 2692 TX on January 16. > >
> > * The graph on the left is related to the total sales volume NFT since the beginning of the new year, as it can be seen at the beginning of the year, we have seen an increase in the number of NFT sales, then since January 17, we have seen a sharp decrease in sales, in 15 Yesterday we saw a slight increase in the Total sales volume. > * The highest Total sales volume nft was 20683 $ usd on January 16.
> * The graph on the left is related to the total FEE volume NFT since the beginning of the new year, as it can be seen at the beginning of the year, we have seen an increase in the number of NFT sales, then since January 17, we have seen a sharp decrease in sales, in 15 Yesterday we saw a slight increase in the Total FEE volume. > * The highest Total FEE volume was 2984 $ usd on January 17.
> # Observations > > * The graph of this section is related to the sale price of NFT since the beginning of the new year on a daily basis and in terms of the lowest, highest and average sales prices. > Since the beginning of the year, the lowest and average prices have had the same daily trend, but in terms of the highest daily price, we have seen a lot of fluctuation, the highest sale price of NFT was on January 17 at the price of $204.
Appendix
The solution of this question and the queries are completely used from the filipside & Metricsdao database
The construction of the dashboard was also used from the site app.flipsidecrypto.com/velocity, which belongs to flipside
My Data :grinning:
discod : esi69#8413
twitter : @oroujiehsan
> # thanks for reading !


> Observation > > * The chart left is of the top 10 NFTs in terms of the trading volume Note. > * First Rank is 1088248 ID with $1558 USD > * second Rank is 3064832 ID with #154 USD > * third Rank is 1676162 ID with $1414 USD
> Observation > > * The chart left is of the top 10 NFTs in terms of the number of trade > * First Rank is 1676162 ID with 101 trade > * second Rank is 1088248 ID with 100 trade > * Third Rank is 2468095 ID with 100 trade > > \
Observations
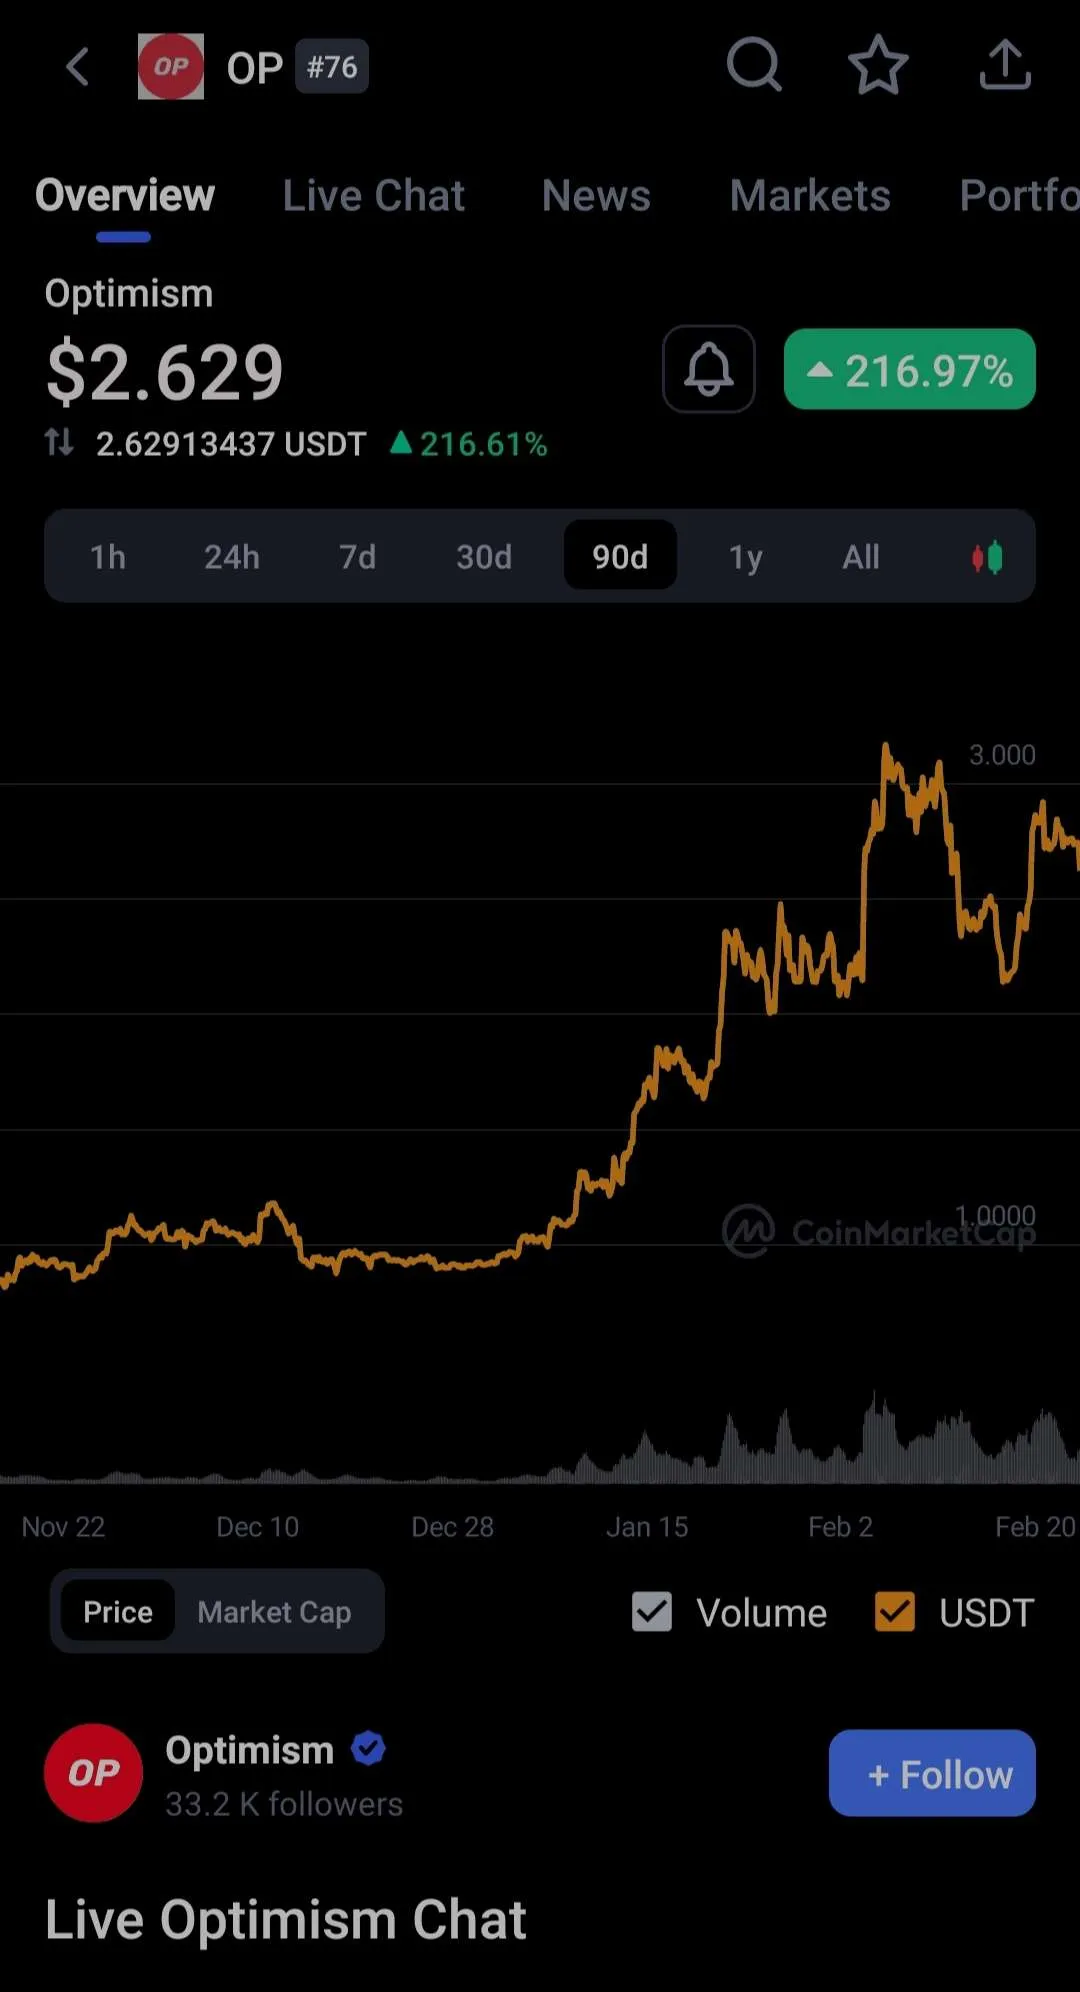
> * The graph you see above is related to the daily chart of the OP price since the beginning of the new year. > * As you can see, we have seen the growth of the OP price since the beginning of the year. > * The highest price is related to the second day of February at the price of 3.12 $ USD > > \