DOT DOT, Who's There?
Introduction
- In this Analysis, You will read about the AxlDot token that I called Dot in my dashboard.
- Following this analysis, I have two goals.
-
- We want to know more about DOT/Osmo Pool ( Pool id 773). Such as :
- users/Volume/join and exit
-
- Also, I looked at Dot trading activities to find out if DOT's trading activity on Osmosis is real user activity or if this is just arbitrageur.
- Identify arbitrageurs
- Swap transactions and volume by normal users and arbitrageurs
Analyzed by Hess - Reading Time Almost 8 Min.
Add and Remove Liquidity
- As you can see, The total daily number of Liquidity providers is much higher than the Liquidity withdrawers. In these charts, Pool Joined means add liquidity, and pool exited means remove liquidity. Since July 2022, The total daily number of Liquidity providers has decreased. The highest number of Liquidity providers was between July 30 and August 16. At that time, The total daily number of liquidity providers was above 150 unique wallets.
- Recently, In December, The total daily number of Liquidity providers decreased to 20-30 users per day, while liquidity withdrawers didn’t change too much.
- Overall, 1578 Unique wallets added liquidity and 644 Unique wallets removed their Liqudity.
Swaps ( Bots Vs. Normal Users )
- We all had at least one swap on Blockchain, which takes over 5 seconds. So, I counted the total number of user swaps per second and filtered those wallets with more than 1 transaction in one second. I found 5 wallets with more than 1 swap per second and called them Arbitrageurs. Recently, The number of Arbitrageurs increased a little.

Method
-
I couldn’t find the Dot price from the Osmosis Dim price table. So, I used the Swap table and examined the swaps from Dot to Stablecoins, and following that, I calculated the daily price of the DOT token.
-
Dot Liquidity Pool
-
We have FACT_LIQUIDITY_PROVIDER_ACTIONS on the Osmosis table. So All I needed was to filter the OSMO/DOT pool id, which is 773. Also, I joined my findings with the price table I explained first to calculate the liquidity volume.
Users have two actions. Joined, which adds liquidity, and exited, which removes liquidity.
Swaps
-
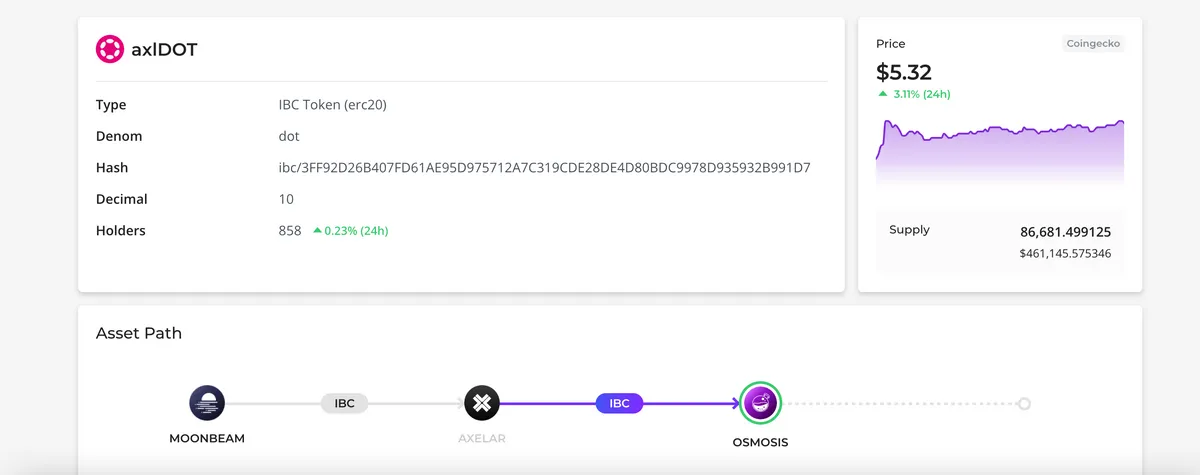
The contract address of Dot token is
ibc/3FF92D26B407FD61AE95D975712A7C319CDE28DE4D80BDC9978D935932B991D7. I used this contract into Swap table and extracted all swap activities.
Arbitrageurs Defination
- We all had at least one swap on Blockchain, and each swap takes over 5 seconds. So, I counted the total number of user swaps per second and filtered those wallets with more than 1 transaction in one second. I found 5 wallets with more than 1 swap per second and called them Arbitrageurs.
OSMO/DOT POOL
Each pool has two sides the user can add Liquidity to. First, Let’s see added liquidity per token.
- The total share of Dot transactions is 31.6%, and Osmo is 68.4%. Almost 2x higher than axlDOT. Nearly 1K users added liquidity with Dot token and 1.5K
-
The highest number of active liquidity providers per week was between Late June and the middle of August.
-
The total number of Liquidity providers in August was 952 unique wallets and 188 liquidity removers. After that month, The total daily number of users decreased and in November reached 336 liquidity providers and 127 liquidity removers. The number of Liquidity providers decreased more in comparison to Liquidity Removers.
The daily share of add liquidity transactions was above 90% on most days since June 2022. Between August 21 and September 15, The daily share of added liquidity decreased by 10-15% because the removed liquidity increased. Again, In late November, The total daily number of removed liquidity transactions increased to 10-25%. Overall, 92.8% of transactions were added liquidity, and 7% removed liquidity.
The Total daily added liquidity volume was much higher than the removed liquidity volume. I drew the below chart that show the total add and remove volume based on number of transactions. Bigger circle means higher number of transactions. Due to that, The removed liquidity volume is like a small Dot.
Total Volume: 1.5M Add Liquidity and 516K Remove Liquidity
Average Volume: 327$ Add Liquidity and 111$ Remove Liquidity
Median Volume: 45$ Add Liquidity and 4.4 Remove Liquidity
Max: 14.4K US dollars Add Liquidity, and 17.2K Remove Liquidity
Min: both actions were below 1$.
Users Breakdown
- The large group of users added and removed liquidity only one time. Interestingly, 449 Unique wallets added liquidity more than 5 times.
- The total volume of a large group of users that added and removed liquidity was between 10-1K US dollars. There were 32 unique users that removed 10K US dollars and 12 unique wallets that added more than 10K US dollars.
I calculated the daily net volume of Osmo/DOT pool over time. As you can see, Until October, The total daily added volume was much higher than the removed volume but after that, The daily added volume decreased and some days removed volume increased. In November and December, on Most days, The daily net volume was negative.
Arbitrage
Arbitrage bot had nearly 30% of total swaps since July 2022 and normal users were 70%. The Arbitrage bot activities increased In November and became higher than Normal users. Overall, there were only 5 bots but you can see their activities were similar to normal users.
The total swap volume of Arbitrage bot was 669K US dollars and the normal user’s swap was 1.9M US dollars. As you can see, like the total number of transactions, Arbitrage bot activities increased in November 2022.
THANK YOU FOR READING!
ALL CODES AND CONTENTS WERE WRITTEN BY HESS.