The Great Solana Royalty Debate
Introduction
- In this analysis, You will read about the top trended topics these days on Solana. 0% Royalties on marketplaces. The most controversial topic on Solana over the past month has been NFT royalties. After platforms like Yawww and Solanart moved to 0% creator royalties, and eventually, Magic Eden followed, the market has been in a chaotic state.
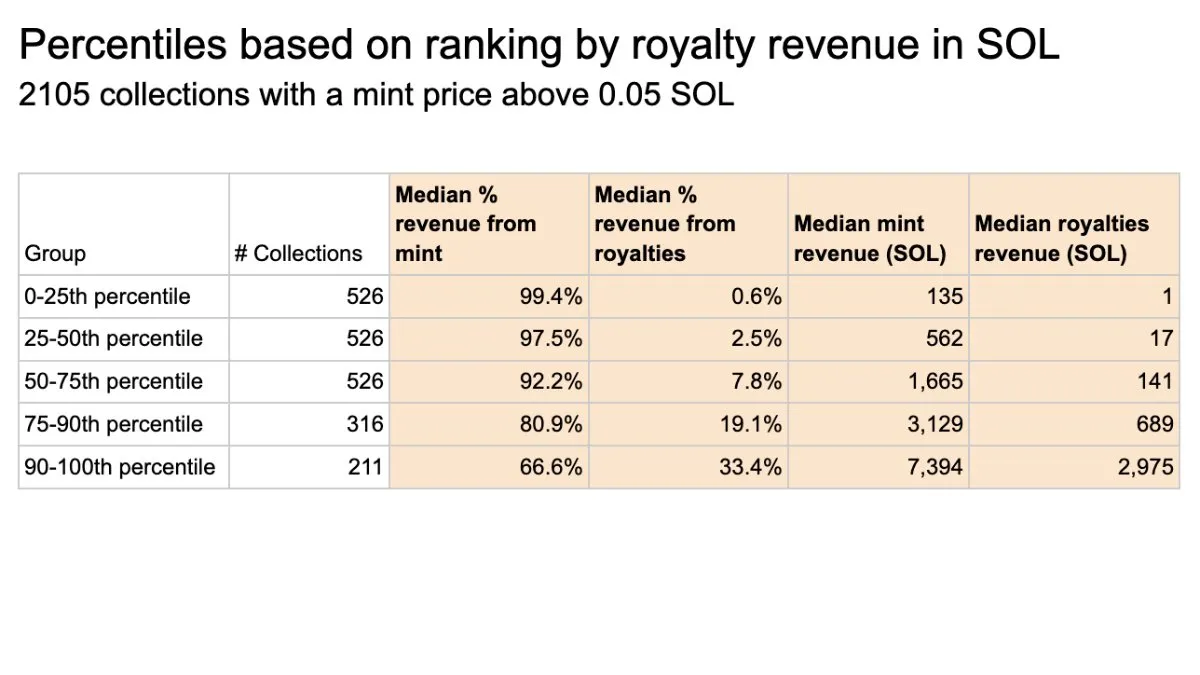
- Magic Eden had cited that almost all funds for a project are coming from the mint, not royalties. We want to know if this is accurate, or a misrepresentation of how successful NFT projects have been operating. What projects have been more reliant on NFT royalties than others? What collections were wallets pivoting towards using 0% royalties more frequently? Higher royalty percentages? Higher floor volumes? Are flowing royalties a sign of project health and sustainability?
- Also, I analyzed 0% royalty collections and royalty collections on the Ethereum chain.
Analyzed By Hess - Reading Time Almost 12 Min
Full Analysis
Top Collections based on Mint and Royalty
I extracted the top 20 collections based on the Mint amount or Volume in USD and the Top 20 collections based on total royalty in Sol or USD.
- Krypto Kronikz is the top collection based on Mint volume. The total mint amount of this collection is 71K Sol or 10M US dollars. On the other hand, Okay Bears is the top collection based on total royalty in Sol or USD. The total royalty of the Okay bear collection is 3M Sol or 197M US dollars. As you can see, The total royalty amount and volume are much higher than the Mint amount or volume. So many of the top collections had free mint and they generated earnings from Royalty.
0% Marketplace sales Vs. Royalty MarketPlace sales
So far, I examined the sales transactions and volume of collections reliant on Mint and Royalty. Now it’s time to examine Marketplaces that have a Royalty system and 0% royalty.
- Based on transactions, Until February 2022, The weekly share of marketplaces with the Royalty system was more than 92%. But after February, The weekly share of transactions of marketplace with 0% Royalty increased and reached up to 65%. Again, for a short time, the weekly share of marketplaces with a royalty sysm increased up to 72% until May. Since July, It seems most transactions went through Marketplaces with 0% royalty.
Normal Sales Vs. Wash sales by 0% Marketplaces
What are Wash sales?
NFT wash trading is a type of scam. Wash trading is a misleading act to drive up the price of NFTs by the buyer and seller. The buyer and seller can sell the piece back and forth to drive up the cost, but only publicly report the first sale.
I examined the wash sales and normal sales on marketplaces with a non-royalty system.
- based on the number of users, most users had normal sales on these marketplaces. About a month ago, When 0% royalty became trend, The total number of wash sales users increased a few in comparison to previous months.
Ethereum Marketplaces
It’s time to examine royalty with non-royalty sales on Ethereum and see how collections are on Ethereum. because Ethereum is a pioneer in NFT worlds and any changes will impact NFTs on other chains.
- Based on sales, The weekly share of sales of collections with royalty was much higher than collections with 0% royalty. However, The shares changed over time. The weekly share of sales of collections with 0% royalty increased over time and reached up to 32%.
What is Royalties?
NFT royalties are crypto payouts designed to proffer creators a cut of secondary sales of their digital collectibles. The percentage of sale designated for royalties is set by the creator at the time of minting — typically around 5-10%.
What is NFT?
NFTs (non-fungible tokens) are unique cryptographic tokens that exist on a blockchain and cannot be replicated. NFTs can represent real-world items like artwork and real estate. "Tokenizing" these real-world tangible assets makes buying, selling, and trading them more efficient while reducing the probability of fraud.
A Summary of The Most Important Findings
- Overall, Royalties generated more volumes and had more transactions in comparison to Mint volumes and transactions.
- Krypto Kronikz, The Top Collection based on mint generated 10M US dollars while Okay Bears, The top collection based on royalties generated 197M US dollars!
- collections Reliant on Royalties had a higher number of sales and sales volume in comparison to collections reliant on 0% royalties.
- The total number of buyers and sellers of both types of NFTs was similar.
- The top marketplace based on 0% royalty is coral Cube and the top marketplace based on royalty is Magic Eden.
- Since April, the share of transactions of Wash sales increased and recently reached up to 30% but based on volume still has a small share.
- On the Ethereum chain, The collections on royalty have more transactions and volume. However, Recently the share of collection reliant on 0% Royalty increased and reached up to 30 %.

Royalty part credited to Jack the Guy. Other Parts were written by Hess.
:bird: Twitter: @hessaminanloo
:flying_disc: Discord: hess#0890
:calendar: Analyze Date: 2022/NOV/07
Mint Vs. Royalty
- Let’s examine and take a quick glance at mint and royalty transactions and volume. It seems mint data is available until September. But based on previous data, As you can see, The total volume in USD generated from Royalty was much higher than the Mint volume. The difference between Royalty volume and Mint is huge. The Royalty volume is more than 1B US dollars while the Mint volume is 151M US dollars.
- Based on transactions, The share of Mint transactions at the beginning of the year was around 50% but over time decreased and reach to 30%. In other hand, The weekly share of transactions of Royalty increased over time and reached from 30% up to 70%.
I filtered the top collections of royalty and mint and analyzed their weekly sales. Based on that, The weekly share of transactions for collections reliant on Royalty increased up to 85% until May. After that, the weekly share of collections reliant on the Mint decreased and took Royalty collections to share. Recently, The weekly share of sales of collections reliant on Royalty increased again and reached up to 67%.
The total number of buyers and sellers of top collections based on mint was higher than buyers and sellers of collections based on royalty until May. After that, The total number of buyers and sellers of collections reliant on royalty increased its difference from the other type of collections until June. After June, The total number of buyers and sellers of both types of collections became near to each other and had similar buyers and sellers.
- Its time to see their sales volume in Sol and USD. As you can see, The top collections based on royalty had more volume in comparison to the Top collections based on Mint. Especially between March and July. Their difference between that time increased. Recently in October, The difference decreased but still Top collections based on Royalty had more volume in comparison to other types of collection.
- The median weekly volume shows that collections reliant on Royalty had more volume in comparison to collections reliant on Mint. The median volume of collections reliant on royalty is 571 US dollars while the median volume of collections reliant on mint is 216 US dollars.
- The average 7 weeks volume moving of Collections reliant of Royaly was much higher than collections reliant on Mint between March and July.
obviously, Royalty marketplaces like Magic Eden had a huge volume since January. But As you can see, Over time, The sales volume of marketplaces with a royalty system decreased over time and the sales volume of marketplaces with 0% royalty increased. Especially in September and October which had more volume in comparison to marketplaces with a royalty system.
The average volume of both types of marketplaces had so many ups and downs and for a short time, the average volume of non-royalty dropped but recently, Again increased and became higher than marketplaces with a royalty system.
- Almost all parameters like transactions and sales volume on Marketplace with a royalty system were much higher than marketplaces with non-royalty system in total but based on weekly sales you have seen how the share of volume and transactions changed over time.
Conclusion
- The right image is Magic Eden's tweet about royalty. In my opinion, all mentioned data is not correct. Based on my analyze, Collection’s most earning were from Royalty not from Mint. They didn’t mention free mint collections. Some of the popular Solana NFT collections were free mint and now the floor price is higher than 100 Sol. Also, Collections reliant on Royalty had similar volume with non-royalty collections.
- As you can see, Over time, the weekly share of wash sales increased up to 11%. Overall, The share of normal sales on 0% royalty marketplaces is 95%, and wash sales are 4.4%. I can say surly most transactions were normal sales.
- Following the number of transactions and number of users, I expected a less volume of wash sales on marketplaces with the non-royalty systems. The total volume of wash sales is 2M US dollars while the total normal sales volume is 100M US dollars.
based on volume, Numbers and stats are different with transactions. Based on Volume, The total sales of 0% royalty collections is 31B US dollars while the total sales volume of Royalty collections is 19B US dollars. However, the total sales volume of royalty collections was higher than 0% royalty collections in October and September.
As you can see, The total sales volume of top collections based on 0% royalty was much higher than top collections based on royalty sales. It seems 0% royalty collections are much popular and have a higher price.