Groundhog Day
Introduction
The crypto market has been experiencing a difficult winter with token prices falling and companies reducing their workforce or shutting down. The latest news of Coinbase announcing another layoff of nearly 20% of employees has added to the gloomy outlook. In light of these events, it's important to consider the potential future of the market. Will we see a spring rally or will the crypto winter continue to linger? In this question, we'll take a look at on-chain data to create a dashboard and make an argument for either a continued downturn or an impending rally in the crypto space.
Methodology
to determine the state of Ethereum and Solana dashboard we will look at:
- Network activity: An increase in the number of transactions on the blockchain network and the number of unique addresses active on the network can indicate increased demand and investor interest.
- DEX Trading volume: A significant increase in trading volume on crypto exchanges can indicate a renewed interest in buying and selling tokens, which could signal a market turnaround.
- Token prices: A sustained increase in the prices of individual tokens or across the market as a whole can indicate a market recovery.
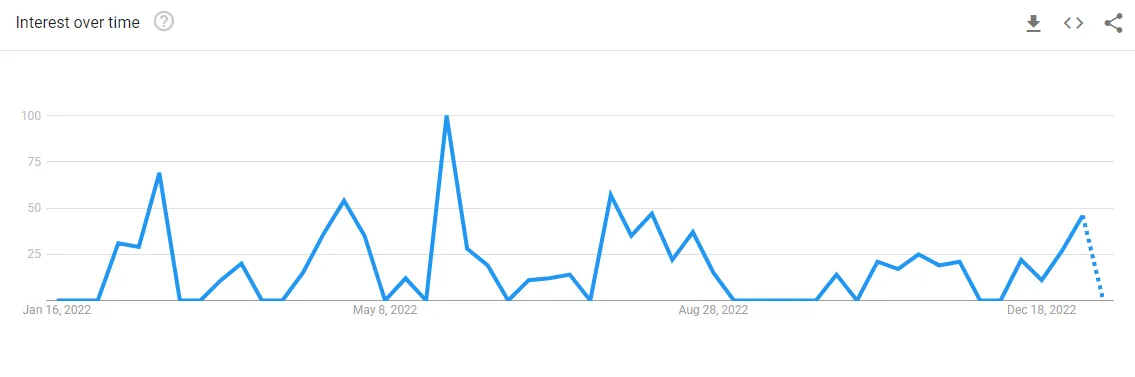
- Google trend: An increase in the number of people searching for specific coins or the crypto market as a whole can indicate renewed interest in the space.
Ethereum Network activity
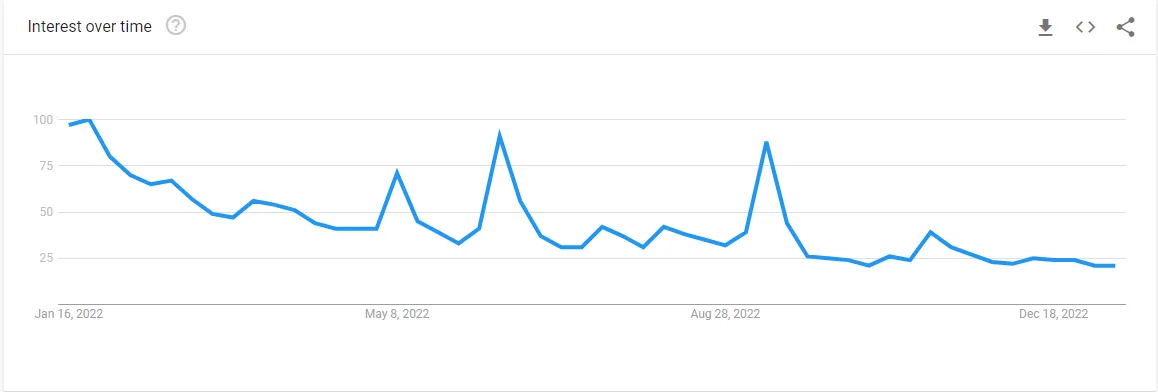
Analysis
The analysis of the provided graph shows a significant decrease in Google searches for Ethereum since the start of the year, with a drop of over 75%. Additionally, the graph shows a decline in gas fees, the number of users, and transactions on Ethereum over the past year. It is worth noting that none of these metrics peaked significantly above their 50-day moving average, indicating a consistent downward trend. This could be an indication of a decrease in interest and engagement in Ethereum. The drop in Google searches could suggest a decline in awareness and interest in the Ethereum network among the general public. The decline in gas fees, users, and transactions could indicate a decrease in activity and usage of the Ethereum network.
Ethereum DEX Volume
Check out the most recent stats at
Analysis
The analysis of the graph shows that Ethereum has not broken its yearly downward trend, indicating that the value of Ethereum has been decreasing over the past year. Additionally, the graph also shows a downward trend in volume for decentralized exchanges (DEXs) built on Ethereum over the past year. This decline in trading volume suggests that there is less demand for buying and selling assets on these platforms. Furthermore, it appears that the number of users on Ethereum-based DEXs has been in decline since the summer of this year. This decline in user engagement could be attributed to the decrease in trading volume and the downward trend in Ethereum's value, as well as other possible factors such as the rise of other blockchain platforms or increased competition in the DEX space.
Arbitrum Network activity
Check out the most recent stats at
Optimism Network activity
Check out the most recent stats at
Polygon Network activity
Check out the most recent stats at
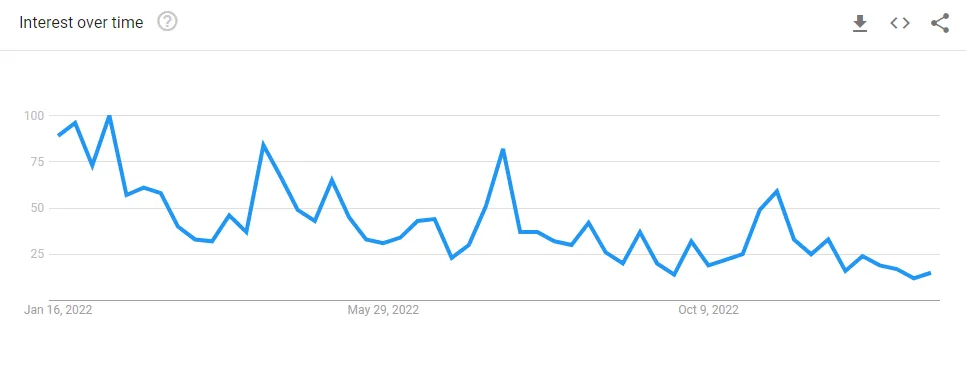
Analysis
The analysis of the graph shows a consistent decline in Google searches for Polygon over the past year, with a decrease of over 80%. This suggests that interest in the platform may be decreasing among the general public. In addition, the graph also shows a slight downward trend in transactions and gas fees on the Polygon platform over the past year. This decline in activity on the platform could be related to the decline in interest as indicated by the Google search data. However, the graph also shows that active users on Polygon were declining until September and have since increased by about 200%. This increase in user engagement is in contrast to the decline in interest and activity on the platform, suggesting that the platform may still be retaining its user base despite the decline in overall interest. Overall, the graph suggests that Polygon is facing a decline in interest and activity on the platform, but still has a dedicated user base. Further research would be needed to understand why the decline in interest and activity is happening, and how it can be addressed.
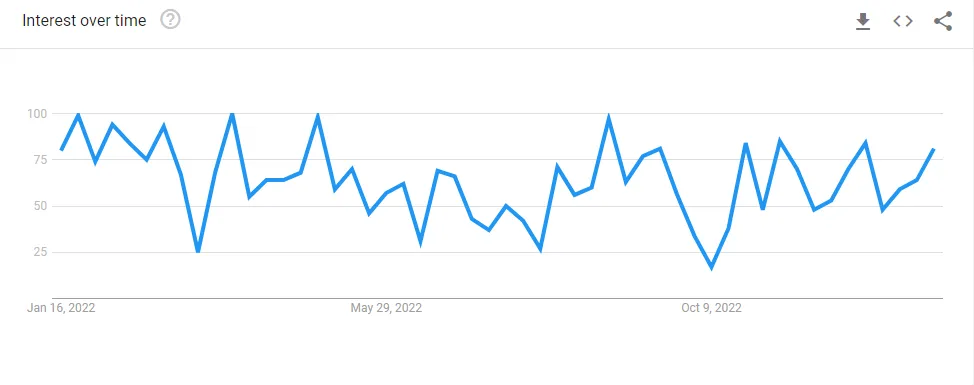
Analysis
The analysis of the provided graph shows a decrease in Google searches for Arbitrum by over 20% since the start of the year. However, it also shows an increase in number of users and transactions on the Arbitrum network. Despite the decrease in Google searches, it appears that the usage of the Arbitrum network has been increasing rapidly, especially at the end of 2022, but also traced back a small amount since the start of the year.This trend could suggest that while awareness of Arbitrum among the general public may have decreased, usage of the network among those who are aware of it has been increasing. This could be due to the network's unique features or solutions it provides that attract more and more users. It's also worth noting that the increase in users and transactions on the network might indicate an increase in activity and usage, which is consistent with the growing number of users. This could be seen as a positive sign for the future of the Arbitrum network, as it suggests that the network is becoming more widely adopted and utilized. However, it's worth considering that the Arbitrum network is still relatively new, and it's not clear what the long-term implications of these trends will be. Further research should be conducted to understand the underlying causes of these trends and their potential implications for the Arbitrum network and the broader blockchain ecosystem.
Analysis
The analysis of the graph shows a clear upward trend in gas fees, number of users, and number of transactions on the Optimism platform since July 2022. This trend indicates that the platform has been gaining popularity and usage over time. The fact that the numbers are consistently above the 50-week moving average suggests that this growth is sustainable and not just a temporary spike.
The most significant increase can be seen in the number of active users, which has grown from 19,000 daily to over 60,000 in this time period. This represents a more than threefold increase in user engagement and suggests that the platform is providing value to its users.
Overall, the graph suggests that Optimism is a growing and successful platform that is seeing increasing usage and engagement from its users. This bodes well for the future of the platform and its continued success.
Conclusion
In conclusion, the analysis of the provided graphs suggests that while the crypto market may still be in a state of volatility, some blockchain platforms such as Arbitrum and Optimism appear to be experiencing growth in usage and engagement, indicating that they are successful and well-used platforms. This suggests that the crypto winter may not be as severe for these platforms. However, the Polygon platform has seen a decline in interest and activity, which could be an indication that it may be facing more challenges in the current market conditions. Overall, the performance of different blockchain platforms can vary greatly the analysis of the provided graphs reveals a clear contrast in the performance of larger and smaller blockchain platforms. While the larger chains appear to be experiencing stagnation in terms of usage and engagement, smaller chains such as Arbitrum and Optimism are showing growth and increased adoption. This trend suggests that, despite some pockets of success among smaller chains, the crypto market as a whole may still be in a state of volatility and in a "crypto winter" phase, particularly for the larger chains.