Thorchain Free Square

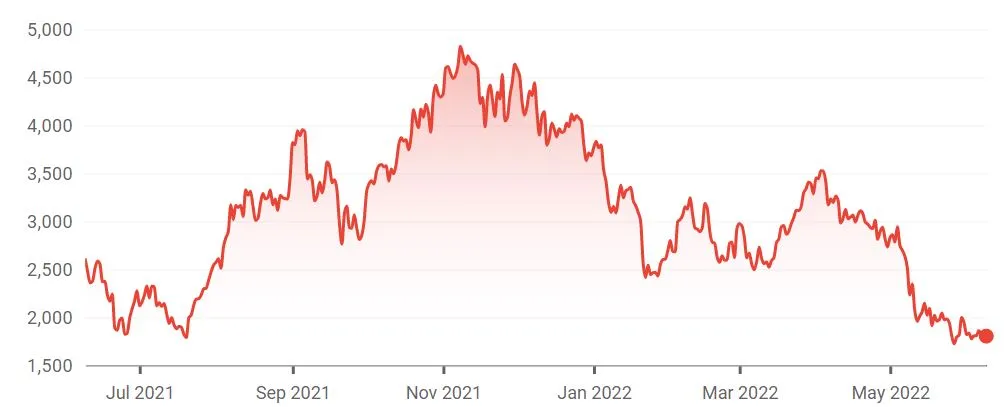
    This dashboard is going to look into how thorchain has performed over time and how that has compared to the value of Ethereum. Ethereum is one of the strongest and most influential blockchains so the performance of Ethereum can have a strong effect on how the rest of the market does. This dashboard will use this information to see how closely related thorchain is the rest of the market and how it has performed indivudially.

    db_img
    Loading...
    Loading...
    Loading...
    Loading...

    Introduction and Methodology

    Thorchain is a liquidity protocol that allows users to swap different layer one assets between each other and acts as a vault. What this means is instead of moving bitcoin into multiple different assets to convert it into ethereum you can use Thorchain to connect both your ethereum and bitcoin wallets, which will allow you to convert one into the other.

    The goal of this dashboard is to see if the performance of the market has had major influence over the performance of the thorchain liquidity protocol.

    The first graph below is a visualization that is showing the value of ethereum over the last year. As you can see it peaked at around 4,750 and ever since has been on a downward slope.

    This next graph will indicate the amount of liquidity fees earned by the liquidity providers. As you can see except for a brief moment during the summer the liquidity fees have remained rather consistent. This would indicate that the value of Ethereum has no relation to the fees earned on thorchain.

    This next graph is going to give information on how much has been swapped over time. As you can see there has been a large amount of swaps recently and this could possibly be due to the fact that people are trying to play the market. As a liquidity protocol it makes sense that the usage would increase as people are trying to move around their assets to make sure they either can make some money or try and reduce the risk and losses they might endure

    The next graph is going to show the TVL of Thorchain and it has done quiet well and been fairly consistent considering the volatility of the market. We can see that the use of thorchain was quite high during the time when the market was going down and has steadied out as the market has stayed low.

    Finally we can see that the price of Rune has been effected by the market as well. Even though the usage of Thorchain has continued the value of RUNE has not been able to dodge the market crash and has actually hit an all time low.

    Conclusion

    • There is a relationship between RUNE and ETH price

    • The TVL has been fairly consistent and the use of thorchain will most likely continue

    • The swaps and TVL hit a high point when the market was moving down very quickly meaning people were using thorchain to move their assets around

    • Liquidity fees are not effected by the performance of the market