Network Performance Dashboard
QUESTIONS
Q95. Create a dashboard displaying Solana network performance over time.
How has the network performed over the past month compared to the rest of the year? Has transaction per second and success rates of transactions gone up recently? Is this because of less botting or fewer users, or new improvements from the Solana engineers? What wallets and programs have paid the most in fees for failed transactions?
\n
INTRODUCTION
Solana network has been plagued a lot with degraded performance since the beginning of the year 2022. It has had 12 serious outages this year alone, with the most recent outage occurring on the 1st of June. This has prompted the Solana foundation and Metaplex to address the situation in different ways which would be explained in this dashboard.
We would be comparing the network performance this past month with the rest of the year. We would analyze if it has improved or not. If it has improved, we would then proceed in analyzing would could be the possible reasons for the improvement. Finally, the top 10 wallet addresses that have paid the most fees in failed transactions would be analyzed and visualized.
METHODOLOGY
- We would start off by analyzing the past month’s network performance using two metrics. These metrics are transactions per second (TPS) and success rates of transactions. We would be visualizing and explaining these metrics. The data for visualizing these metrics were obtained by querying the
solana.core.fact_transactionstable. - Next, after analyzing the network performance above, if any improvement is noted this past month, we would examine the possible reasons for the improvement. The data for this was obtained by querying the
solana.core.fact_transactionsandsolana.core.fact_eventstables. - Finally, the wallets and programs that have the most fees in failed transactions during degraded network performance would be examined. Querying the
solana.core.fact_transactionsand thesolana.core.dim_labelstables helped in getting this data. `
RESULTS
Both bar charts above clearly show the Solana network performance from the beginning of January 2022 to date. We can see there is a positive correlation between the two depicted network performance measuring metrics (i.e. TPS and success rate). A downtrend in network performance that started roughly at the start of the year, and stopped around April/May. An uptrend in network performance started in May and it’s still in an uptrend to date.
So, both the transactions per second and success rates have gone up this past month compared to the previous 5 months, which means there is an improvement in network performance recently. However, the network is still yet to attain or surpass the highest TPS value (i.e. 772.1652 TPS) and the highest success rate value (83.0417 %) both attained on the 1st of January and 17th of March this year respectively.
We are going over the possible reasons for this recent network performance improvement:
-
New improvements from Solana developers: The Solana foundation plans to soon roll out some upgrades which include a protocol called QUIC (Quick UDP Internet Connections), an upgrade to UDP (User Datagram Protocol), the presently used protocol which handles how transactions are sent on the network. These upgrades promise to improve the network performance significantly once deployed. However, since they haven’t been implemented yet on the Solana mainnet Beta, they can’t be the reason for the recent network performance improvement
\
-
Fewer users: A negative correlation can be observed between the TPS and the number of unique signers in the line chart on the right above i.e. they are moving in opposite directions. Recently, we can see that the lower the number of signers (i.e users), the higher the transactions per second. In other words, fewer users or signers is a possible reason why there has been an improvement in network performance this past month.
NB: A signer is an account that authorizes transactions on the Solana network
\
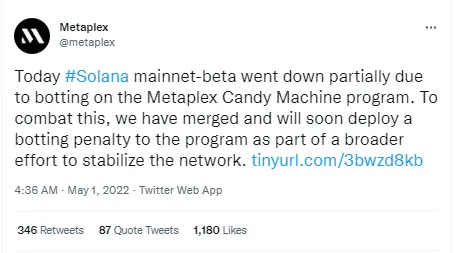
- Less botting: Another negative correlation is observed between transactions per second (TPS) and the number of deployed programs in the line chart shown above on the right. This shows that the number of deployed programs has significantly reduced this past month, which led to an improvement in network performance. Since bots have been the major cause of most of the outages Solana has experienced so far this year leading to degraded network performance, it stands to reason that the deployment of bot programs has also drastically reduced due to some reason. If the deployment of bots has reduced, it means the usage of bots to overwhelm the network has reduced as well. This reduced number of deployments could be attributed to the antibot tax implemented by Metaplex on the 1st of May as it coincides with the beginning of the downtrend observed in the program deployment line chart. A screenshot that displays the Metaplex antibot tax announcement is shown below.
As observed above, all listed top 10 addresses are wallet addresses. Not even one program id is among them, this could be because programs can’t directly sign transactions, except through their derived addresses, as a result, they won’t be able to pay transaction fees. The total fees are all expressed in Sol. The first address on the list, CuieVDEDtLo7FypA9SbLM9saXFdb1dsshEkyErMqkRQq, has incurred a total fee of 1010.63 Sol in failed transactions since the beginning of the year to date and has paid 23% of the total fees paid by all 10 wallet addresses. The address is also rumoured to belong to Alameda Research, a trading firm founded by Sam Bankman-Fried, CEO of FTX exchange. The second address (Y2akr3bXHRsqyP1QJtbm9G9N88ZV4t1KfaFeDzKRTfr) has paid around half of the fees the first address paid.
CONCLUSIONS
- The Solana network performance has improved quite significantly this past month
- Metaplex antibot tax may have contributed to this improvement in the network performance.
- The reduced number of signers or users this past month may have led to an improvement in network performance as well