Polygon Daily Transactions and Unique Addresses
Metodology:
This dashboard was created using the polygon.transactions table.
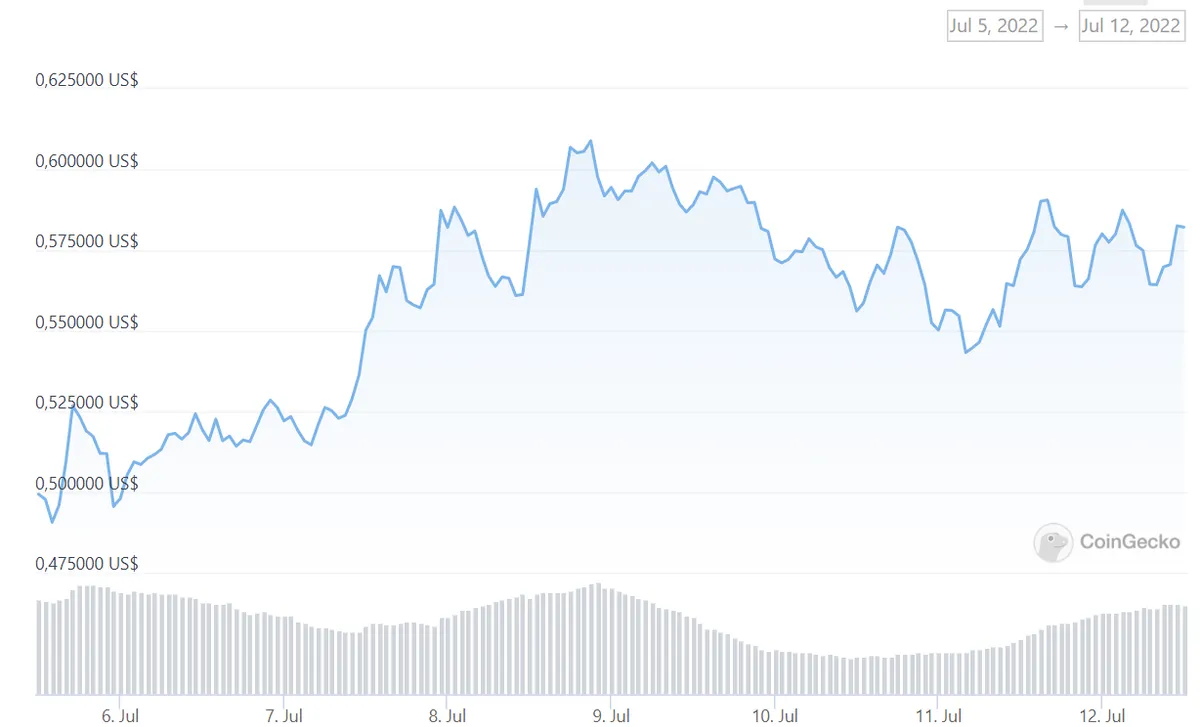
The external price chart was taken from https://www.coingecko.com
An almost 20X Rise in daily transactions between July 5th and 6th. The new daily transaction level would seem to be holding between 2.1M and 2.8M. (having risen from 140k-250k).
Conclusions:
Explosive growth seems to have ocurred from July 5th to 6th, on all measuring points. The Tx amount growing more than the user amount (X20 vs X7/X12) means that there are not only more users, but that these and or previous users are transacting more often too.
All charts have a small price sensitive tendency. Following the patern seen at the bottom of the coingeko price chart (in bars) growing from July 6th to 8th falling a little up to July 10th and growing once again during the 11th and into the 12th.
Bear in mind that the data from July 12th is incomplete since it is the day of the creation of this dashboard.
To answer the bounty question Poygon seems to be growing (or at least had an explosive spike) since July 6th. This possibly might have to do with the Reddit NFT news which occurred at a similar date.


Daily volume of unique user addresses (Senders vs Recievng addresses). The rise in transaction level seems to have also ocurred in amount of distinct users with senders X7 and recievers X12 from July 5th to July 6th. Logically there always seems to be more senders than recievers. The trend, as with transaction levels, seems to be sustainig itself at the new levels.
The chart above represents total summed daily gas fees. There seems to be some unavialable data, but by looking at July 5th and the previous charts we can see it follows the same tendency of increase starting July 6th. in this case the jump between said dates was X17. From 1400 USD to 25k USD.
In this case we have more noticable correlation between the gas chart and Polygon price (makes sense since its gas in USD). Both rise from July 6th to 8th falling a bit up to July 10th and risng again on the 11th.
This price following ca bee seen in some small measure among all the charts but is much more noticable here since the the chart shows (gas amount * price in usd), and is therefore much more sensitive to changes in valuation.