Solana Adoption: L1 Users
L1 Unique Users on Solana vs Competitor Chains
Flipside Crypto Solana Question 37: Compare the number of unique wallets that have sent a transaction since February 1st on Solana vs Ethereum vs Terra. How does user adoption seem to be trending for Solana compared to these other major chains? Does it appear that market conditions are slowing down growth or activity on the networks?
Intro
This analysis contrasts the number of unique wallets on Solana vs Ethereum vs Terra since February 1st, 2022. It compares Solana's user adoption trends to these chains, and looks for influence of market conditions on Solana network activity.
Method
To gain insight around user adoption of these three major Level 1 (L1) blockchains, we will count the number of unique wallets that sent at least one transaction on a L1 chain (in this case Solana or Ethereum or Terra) on a given date.
To understand any influence that market conditions may have on Solana user adoption we will use as a proxy the daily USD price of the SOL native token.
A note on choosing token price as the metric: A variety of metrics could be used to describe a notion as broad and vague as 'market conditions.' For instance, one could look at token volume or total value locked (TVL). We chose the market price because it can be seen as a metric less correlated with our main metric in this analysis (number of unique users), compared to how the number of transacting accounts would not be independent from something like dollar values or token volumes (more users -> highter transacted amount).
The dynamic graph of unique daily wallets automatically updates daily to reflect the numbers for the current date. The remaining parts of this analysis (static images and text interpretation of data) are current as of March 16, 2022.
Where do Solana L1 active users stand, compared with Ethereum or Terra?
From the chart below we see how Ethereum has the most number of wallets that send transactions per day. Since the beginning of February 2022, anywhere between 336k and 515k unique wallets a day initiated transactions on Ethereum.
This is followed by Solana activity: 146k to 254k unique wallets sent transactions daily since the start of February.
Finally, the lowest activity of the three chains is exhibited on Terra: 30k to 62k unique wallets per day.
Of these three major chains, Solana is not the most active in terms of unique users, but neither is it the chain with the lowest adoption numbers. Among the chains we compared it with, Solana's adoption sits squarely in the middle.
Is there a trend?
There appears to be some fluctuation in the usage of these L1 ecosystems, rather than a clear trend direction. The next part of this analysis below looks at how market conditions may be interplaying with Solana L1 adoption.
Does State of the Market Affect the Number of Users?
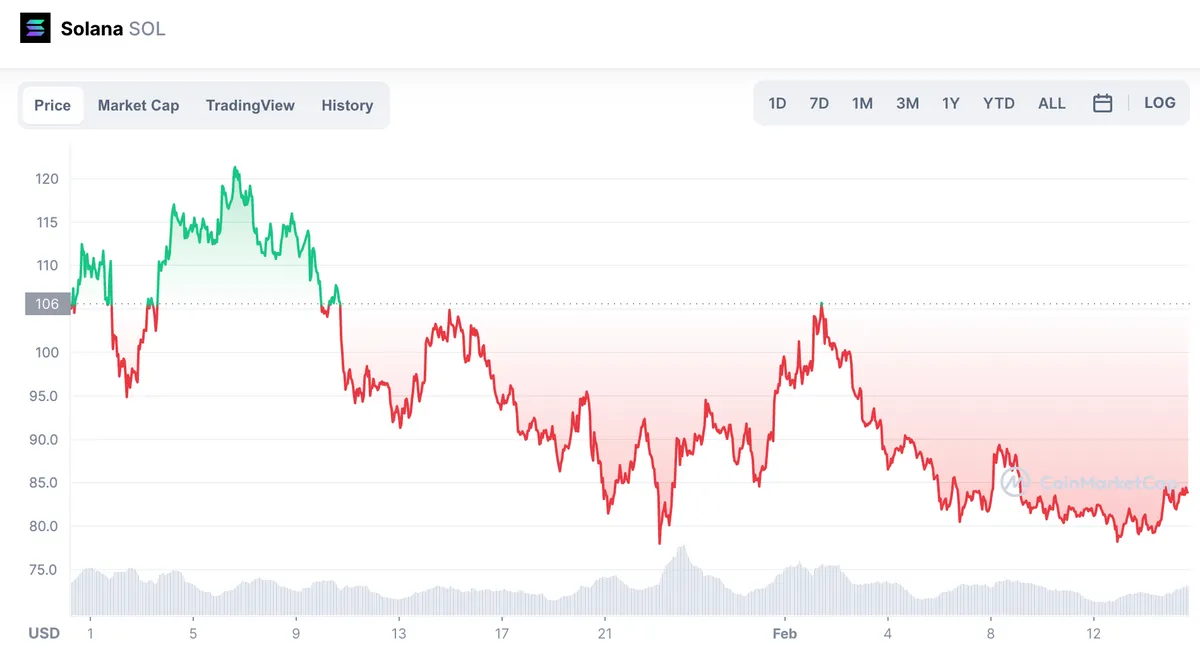
The graph below shows the daily USD price fluctuations of Solana's native token, SOL, between February 1 - March 16, 2022. It can help understand the market backdrop against which user adoption of Solana as a L1 blockchain is taking place.
Comparing the SOL price peaks and valleys (below) with Solana unique wallets (on the above graph), we can see visual parallels. Many dips and rallies of SOL price are also reflected in the number of wallets transacting.
However, one notable disconnect between market price fluctuations and usage fluctuation can be found in levels. While the same trends have echoed in both the price and the usage metrics, we see that when the price dipped below early-February levels and stayed below them, the number of wallets mirrored the same trends but its levels always bounced back, even exceeding February levels with a record 254k wallets on March 6, 2022.
Solana L1 usage mirrors SOL price's trends but maintains and even exceeds a baseline level.
This suggests that markets have some effect on Solana L1 adoption, but there is a fundamental underlying demand for using the Solana blockchain that goes beyond trend peaks and valleys.
Image source: CoinMarketCap.
TLDR: Takeaways
-
The number of daily unique wallets sending transactions on Solana (146-254k unique wallets/day) is far below the number of wallets on Ethereum (336-515k unique wallets/day).
-
However, Solana wallet adoption is several times that of Terra (30-62k unique wallets/day).
-
Solana L1 usage mirrors SOL price's trends but maintains (and at times even exceeds) a baseline level.
-
Markets have some effect on Solana L1 adoption, but there is a fundamental underlying demand for using the Solana blockchain that goes beyond trends.