Quix vs Magic Eden vs OpenSea
Create a dashboard highlighting at least 3 metrics comparing marketplace performance and adoption between Quix (formerly Quixotic) on Optimism, Magic Eden on Solana, and OpenSea on Ethereum, since July of this year.
Metric and method
I want to compare the three nft markets place (Opensea, Magic Eden, and Quix)in 2022 in this dashboard. Metrics that we will discuss in this dashboard
volume usd
volume transection
buyer and seller
count NFT sell
Daily nft sell
popular nft
in the first two periods of the year and July until today
The tables optimism.core.ez nft sales, ethereum.core.ez nft sales, solana.core.fact nft sales, and optimism.core.fact event logs are going to be the primary ones that we consult in order to complete this bounty.
\n
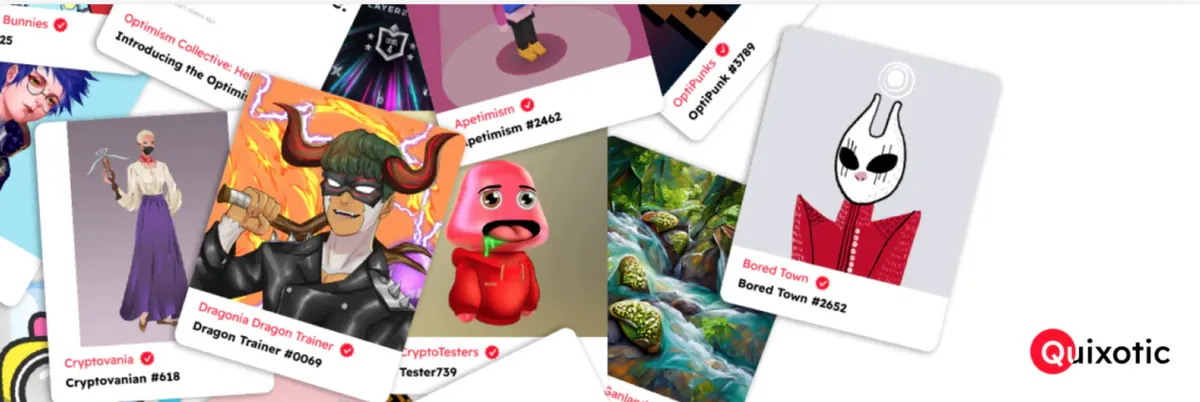
popular and nft daily sale in QUIX 📊
We can see that the ==optipunk== collection was the major volume of the market at the beginning of the year, but according to the daily sales volume, we can see that the apetimism collection has managed to achieve a high volume, especially in July, this volume is very evident.
First, let's see what are the differences between buyers and sellers in these three markets
It is interesting that the number of buyers and sellers in Opensea has ==decreased== significantly, while Magic Eden shows an interesting ==increase== in the number of users even though the market is down, it seems that Solana's NFTs are seeing another hype.
And as for Quix Place Market, although the number of users has decreased drastically recently, we see a ==huge amount of users== in July, but why?
Introduction
Quixotic is the largest NFT marketplace on Optimism.
==Open Sea== is the world’s first and largest NFT marketplace which is created on Ethereum originally.
==Magic Eden== NFT marketplace was launched in September 2021 and quickly became a dominant force in the NFT ecosystem. In a virtual world where most NFT marketplaces are built on Ethereum, Magic Eden’s position on Solana gives it a competitive advantage
==Let's look at the dollar volume of these three markets==
If we compare the charts below and with the charts above, we can conclude that although the volume of transactions and users is increasing in Magic Eden, the dollar volume does not show such an increase in the market, even though we had a good volume of users quix on July 17, but the dollar volume is almost insignificant. Maybe it can be concluded that NFTs are bought and sold for very low amounts due to market conditions
popular and nft daily sale in opensea 📊
On May 1st, the sales volume of the collection the ==otherside== has reached ==317m$,== which is the highest volume since the beginning of this year.
When we look at two time periods Satisfying progress has been seen by the ENS and OpenSea collection on the OpenSea, to the point where they have surpassed Clone X and Azuki, but they still have a ways to go before they can catch up to the best performing NFT collection, Bored Ape Yacht Club.
conclusion✨
It is intriguing that Opensea has had a big decline in the number of buyers and sellers also nft token and volume usd and transection
Magic Eden displays an intriguing rise in users despite a declining market and follow volume transection and token sell it but not intersting usd volume.
QUIX Despite a significant decline in recent months, we saw a great number of users in July and follow volume too but not by usd volume
So much tokens are exchanged and transacted on Magic Eden's marketplace than on OpenSea and Quix.
While Magic Eden and Quix are continually changing, as seen by the statistics above,
The( OtherSide and Bored | Mutant Ape Yacht Club) are regularly among the top collections on OpenSea.