Thorchain - L1 Deposit rate
In this dashboard, we will look at swaps from Native assets to RUNE, which lead to deposit of Native assets into the Thorchain Ecosystem.
We will use thorchain.swaps table to aggregate the data required. As we are primarily looking only at Native deposits, we can exclude Synth MINTS. We will filter out single swap transactions by finding all tx_ids which have only one hit. Then we will find the swaps that result in RUNE being sent to the user, aggregate by chain of the asset deposited as well as the asset itself. We will only look at day from May 2022 onwards to narrow to recent trends.
Let us look at Swaps made by chain.
- BNB is outright the most swapped in chain, with 92 percent of all swap ins.
- The rest of the chain combined makes less than 10 percent of all activity.
- Terra used to be 2nd place, but now being discontinued means BTC is the second most populate chain.
- BNB's dominance probably stems from the fact that BNB was the first native chain to be included on Thorchain, and allows decentralized way to exit BNB chains
Looking at the same data by assets:
- BUSD is the most popular asset, by a comprehensive margin (66 percent)
- BNB and BTCB, both BNB based tokens come 2nd and 3rd
- Before the May crash, UST was the largest non-BNB based asset. However now that falls to BTC.
- From the daily plot, the daily dominance of the top 3 assets are clear.
Now looking at the swap volumes in USD:
- Yet again BNB is the top chain.
- However, the monopoly is slightly less compared to transaction volume, only 86% compared to 92%
- This means, other chains esp those like ETH and BTC while having smaller number of swaps, have in general larger swap sizes.
- This is evident as BTC leapfrogged Terra in the volume section.
- Inspite of the larger swap size, BNB is a tough nut to dethrone.
Looking at the swap volumes by Asset
- BUSD, BNB retain the first two spots
- However, the thirdspot is surprisingly held by BTC instead of BTCB.
- This suggests that BTC swap sizes are larger than the Binance variant.
A similar analysis was done almost 2 quarter ago - here . In that analysis, we saw significant dominance by Binance Chain based assets. As the chain was in relative infancy, and restarts post multitude of hacks, we expected as the network matures, it will have increasing percentage of the assets like BTC and ETH. However this hasn't been the case and its more likely that the dominance has grown over time.
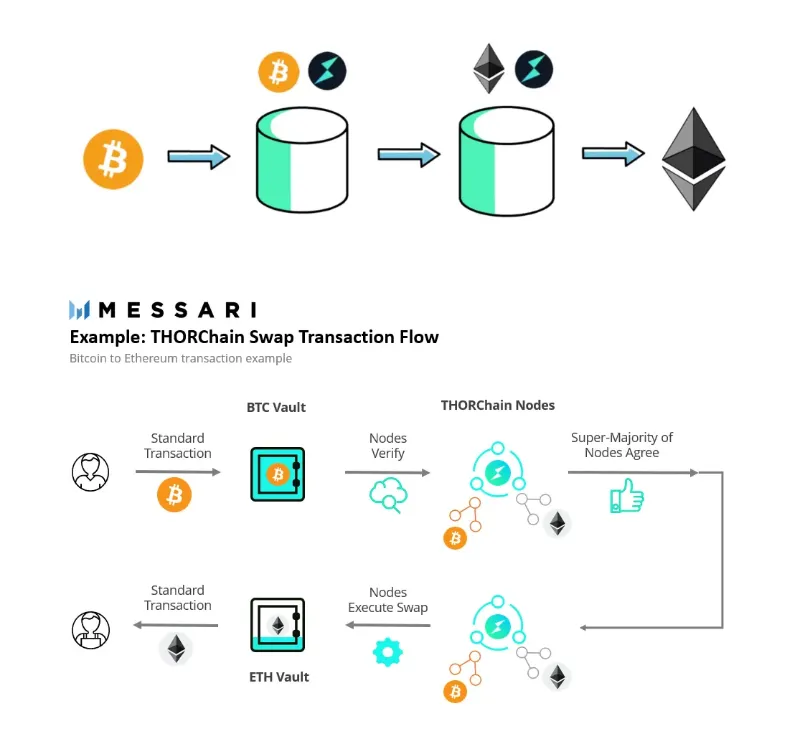
Swaps on THORChain are made possible by liquidity pools. These are pools of assets deposited by Liquidity providers, where each pool consists of 1 connected asset, for example Bitcoin, and THORChain's own asset, RUNE. They're called Continuous Liquidity Pools because RUNE, being in each pool, links all pools together in a single, continuous liquidity network.
When a user swaps 2 connected assets on THORChain, they swap between two pools:
-
Swap to RUNE in the first pool
-
Move that RUNE into the second pool
-
Swap to the desired asset in the second pool with the RUNE from
These pools are created by synchonising, a native vault on the respective chain and RUNE vault on thorchain. These pools follow the constant product AMM formula, hence tend to keep the product constant. So when a swap is made, the incoming Native token cause a flow of RUNE from one vault (BTC vault) to the other vault (ETH vault) . Now as the constant product AMM rebalances the pool, the excess native token (ETH) is release to the user.
(pics courtesy of Finematics and Messari Crypto)