Thorswap - Price Activity correlation
Rune price is available in the prices table, while the swap count and the volume of swaps can be taken from the swaps table.
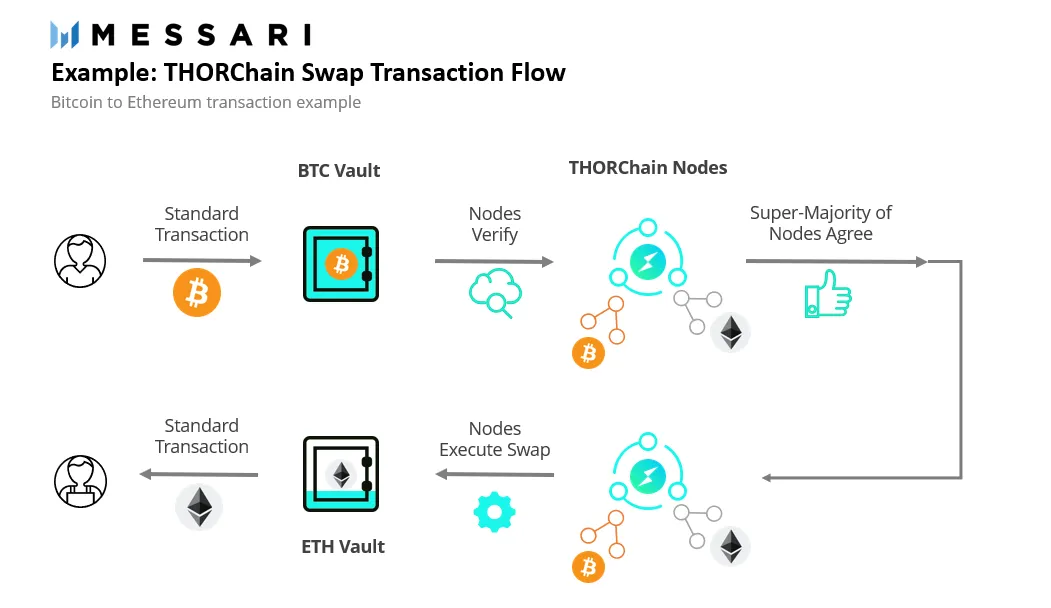
Thorswap facilitates swapping of digital assets across chains in a single transaction in a trustless, permission-less manner.
Swaps on THORChain are made possible by liquidity pools. These are pools of assets deposited by Liquidity providers, where each pool consists of 1 connected asset, for example Bitcoin, and THORChain's own asset, RUNE. They're called Continuous Liquidity Pools because RUNE, being in each pool, links all pools together in a single, continuous liquidity network.
When a user swaps 2 connected assets on THORChain, they swap between two pools:
-
Swap to RUNE in the first pool
-
Move that RUNE into the second pool
-
Swap to the desired asset in the second pool with the RUNE from
These pools are created by synchonising, a native vault on the respective chain and RUNE vault on thorchain. These pools follow the constant product AMM formula, hence tend to keep the product constant. So when a swap is made, the incoming Native token cause a flow of RUNE from one vault (BTC vault) to the other vault (ETH vault) . Now as the constant product AMM rebalances the pool, the excess native token (ETH) is release to the user.
(pics courtesy of Finematics and Messari Crypto)
From the above two graphs we can see a negative correlation between prices and Swap volumes. Around March April, when the volume was low we can see the RUNE price is pretty high, where as we can see the price crash and volume pickup post crash
This can also be see using a correlation function provided natively by Snowflake SQL below.
However, this correlation cannot be held as a valid metric right now as :
- Most of the activity data we have is from a Bear-Market or a Recovery-Market. We have little Bull market data, only couple of months, compared to around 4 months of Bear-Market data. As these Bull-Bears are cycles, we will need the protocol to go through atleast one full cycle to find a confident trend in data.
- The protocol launched just before the end of a Bull cycle. Hence its user growth only took place gradually during the Bear-Market. This is why there is a negative correlation. Growth was during Bear market, when the price of the token itself was low.
We haven't seen the mainnet launch of Thorchain yet. It's still mostly in a public beta. We are also still in a recovery market. This means, we gotta see this correlation value merely as a coincidence of market condition and protocol launch rather than an inherent trend in the price of the token of swap volume.