2022 Retrospective [Ethereum]
Let’s explore some key indicators of the health of the Web3 industry. Project ETH supply growth for 2023 by using various average gas prices. What is the highest value DEX swap, by protocol? Where was there the most DEX swaps by protocol? Which were the highest gas consuming NFT mints? Bonus: share the results on Twitter and tag @flipsidecrypto and any other projects you reference.
Acknowledgment and Supplementary Information
- Author: NSA2000
- Twitter of the Author: @NSA2000C
- Discord of the Author: NSA2000#5651
- Data from FlipsideCrypto
- I would like to show my sincere gratitude to the authors of the following dashboard (Abbas_ra21 and Ali3N) whom I thankfully burrowed their SQL codes in order to do my own analysis: * *
Introduction
==Introduction to Web3==
Centralization has helped onboard billions of people to the World Wide Web and created the stable, robust infrastructure on which it lives. At the same time, a handful of centralized entities have a stronghold on large swathes of the World Wide Web, unilaterally deciding what should and should not be allowed.
Web3 is the answer to this dilemma. Instead of a Web monopolized by large technology companies, Web3 embraces decentralization and is being built, operated, and owned by its users. Web3 puts power in the hands of individuals rather than corporations. Before we talk about Web3, let's explore how we got here.
==What is Web3?==
Web3 has become a catch-all term for the vision of a new, better internet. At its core, Web3 uses blockchains, cryptocurrencies, and NFTs to give power back to the users in the form of ownership. A 2020 post on Twitter said it best: Web1 was read-only, Web2 is read-write, Web3 will be read-write-own.
==Core ideas of Web3==
Although it's challenging to provide a rigid definition of what Web3 is, a few core principles guide its creation.
- Web3 is decentralized: instead of large swathes of the internet controlled and owned by centralized entities, ownership gets distributed amongst its builders and users.
- Web3 is permissionless: everyone has equal access to participate in Web3, and no one gets excluded.
- Web3 has native payments: it uses cryptocurrency for spending and sending money online instead of relying on the outdated infrastructure of banks and payment processors.
- Web3 is trustless: it operates using incentives and economic mechanisms instead of relying on trusted third-parties.
==Why is Web3 important?==
Web3's killer features are mainly Ownership, Censorship resistance, Decentralized autonomous organizations (DAOs), Identity, and Native payments []
Methodology
> # ==The following tables have been used in this dashboard in order to extract data:==
>
> * ethereum.core.fact_transactions
> * ethereum.core.ez_current_balances
> * ethereum.core.fact_blocks
> * ethereum.core.ez_dex_swaps
> * ethereum.core.ez_nft_mints
> * ethereum.core.dim_labels
> *
>
> > # ==Aim of this dashboard:== > > # This dasboard aims to investigate the Ethereum supply as well as DEX swaps and NFT mints variations and trends during the past yeras since 2016 and within the year 2022 in order to answer the following questions: > * What is the highest value DEX swap, by protocol? > * Where was there the most DEX swaps by protocol? > * Which were the highest gas consuming NFT mints?
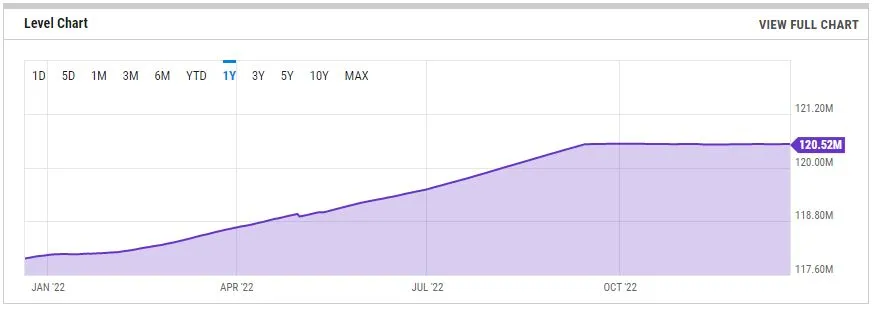
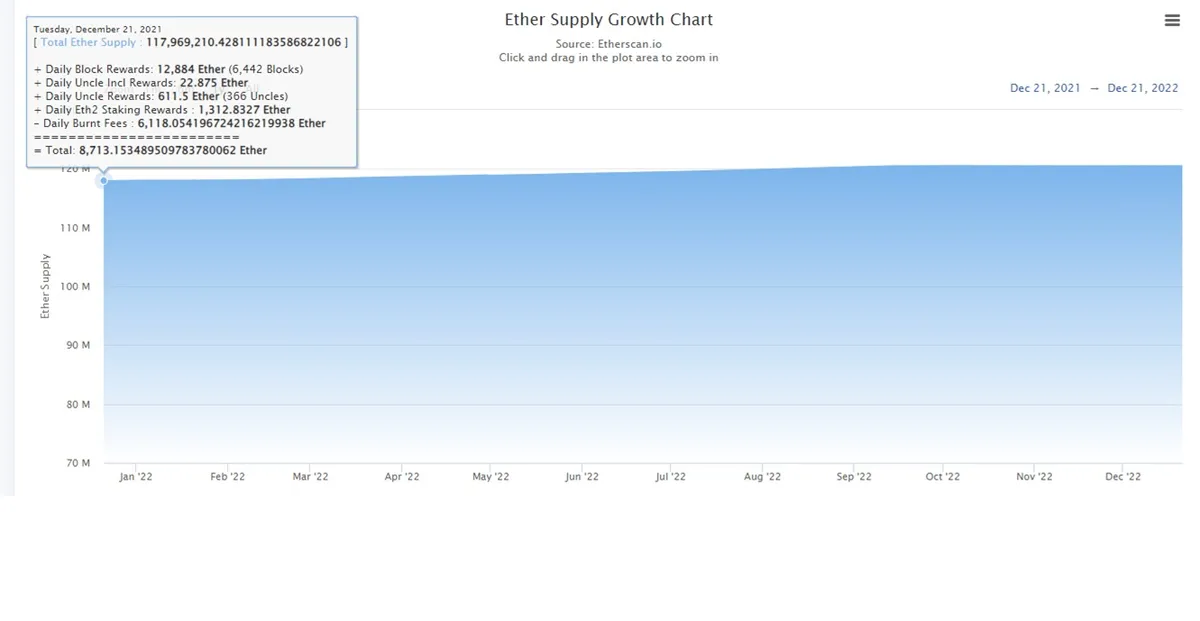
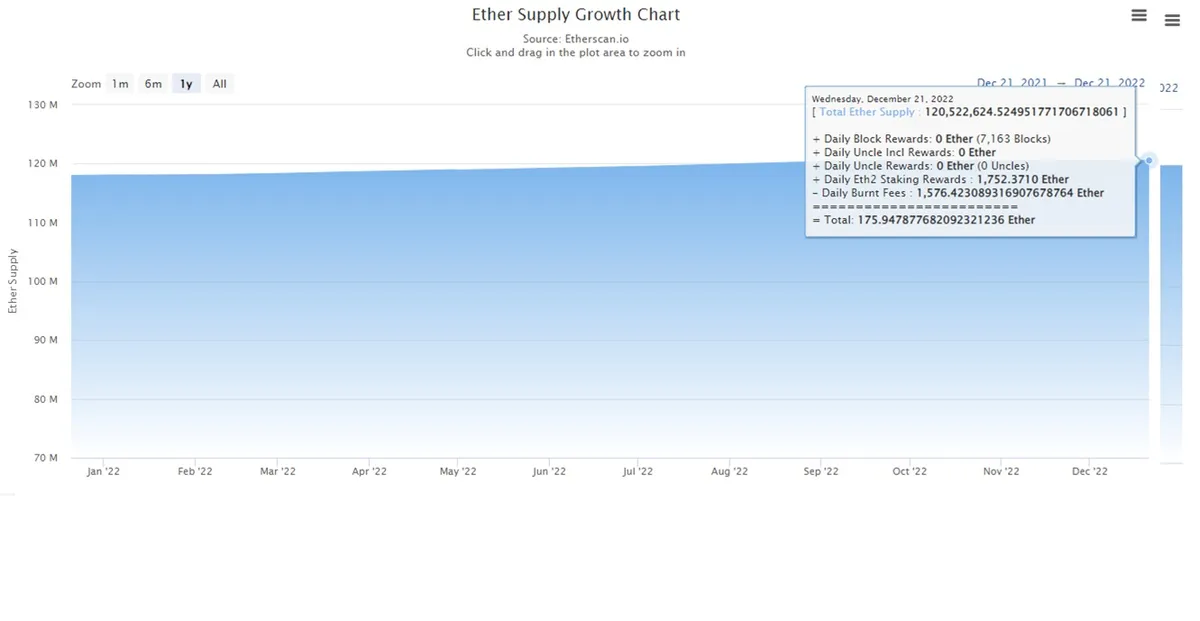
==The following charts show the daily variation of ETH supply during 2022 (according to data from Etherscan [] and YCharts [] as well as FlipsideCrypto database) as well as a prediction of its trend for the next year according to FlipsideCrypto database.==
The daily variation of ETH supply during 2022 show a rather increasing trend and it can be observed that the data obtained from the FlipsideCrypto database is compatible with the data from Etherscan and YCharts as well. Moreover, it can be observed that according to the cumulative ETH supply of each month for the next year (2023), the growth rate of ETH supply is rather increasing as a result of the more distributed staking rewards (it is worth mentioning that this trend is rather similar to the recent month of this year (2022)).
The daily variation of the gas price (average, median, 7-MA, and 21-MA) shows a significantly decreasing trend, especially during the first half of the year. This trend is also rather decreasing during the second half of the year and reaches its minimum amount of Dec 2022. The same trend for the monthly variation of the amount of ETH burned during the past year can be seen. The cumulative monthly variation of the amount of ETH burned shows that the total amount of ETH burned is about 1.46M.
The monthly variation and distributions of the DEX swap transactions and users for different protocols show that uniswap-v2, uniswap-v3, and sushiswap have the upper hand by far among the other protocols. As far as the max DEX swap transactions volume is concerned, curve, uniswap-v2, and balancer are superior to other protocols. Moreover, synthetix, curve, and balancer are the most popular protocols by regarding the average DEX swap transactions volume.
These charts show that the most popular NFT projects according to the total consumed Gas fee by minting NFTs during the past year (2022) are the otherside, ens, and vaynersports pass. As far as the average consumed Gas fee by minting NFTs is concerned, otherside, vaynersports and karafur have the upper hands. tubby cats, the saudis, and hedgies by dydx are the most popular among NFT projects regarding the max consumed Gas fee by minting NFTs during the past year.
> # Summary
> \
> # The aim of this dasboard is to analyze the Ethereum supply and DEX swaps as well as NFT mints variations and trends during the past yeras since 2016 and within the year 2022.
> # The daily variation of ETH supply during 2022 show a rather increasing trend and it can be observed that the data obtained from the FlipsideCrypto database is compatible with the data from Etherscan and YCharts as well.
> # Moreover, according to the cumulative ETH supply of each month for the next year (2023), the growth rate of ETH supply cannot be so high as a result of the more distributed staking rewards (it is worth mentioning that this trend is rather similar to the recent month of this year (2022)).
> # A significantly decreasing trend has been seen for the daily variation of the gas price (average, median, 7-MA, and 21-MA) shows , especially during the first half of the year. This trend is also rather decreasing during the second half of the year and reaches its minimum amount of Dec 2022.
> # The monthly variation of the amount of ETH burned during the past year was also decreasing. The total amount of ETH burned was about 1.46M.
> # The monthly variation and distributions of the DEX swap transactions and users for different protocols show that uniswap-v2, uniswap-v3, and sushiswap have the upper hand by far among the other protocols.
> # As far as the max DEX swap transactions volume is concerned, curve, uniswap-v2, and balancer are superior to other protocols.
> # synthetix, curve, and balancer are the most popular protocols by regarding the average DEX swap transactions volume.
> # The yearly variation of the consumed Gas fee (total and average) by minting NFTs shows a rather increasing trend since 2016, wheras the monthly variation of the consumed Gas fee (total and average) by minting NFTs during 2022, showed a rather decreasing trend
> # While the yearly variation of the number of mints and minters since 2016 is increasing significantly, the monthly variation of the number of mints and minters during 2022 is fluctuating
> # The max number of mints recorded on 1 Apr 2022 4.35M) and the max number of minters is recorded on 1 Sep 2022 (779.02K)
> # The most popular NFT projects according to the total consumed Gas fee by minting NFTs during the past year (2022) are the otherside, ens, and vaynersports pass.
> # As far as the average consumed Gas fee by minting NFTs is concerned, otherside, vaynersports and karafur have the upper hands among other NFT projects.
> # tubby cats, the saudis, and hedgies by dydx are the most popular among NFT projects regarding the max consumed Gas fee by minting NFTs during the past year.