District Deep Dive: Contracts Deployed [NEAR Protocol]
Building on work from The Law Offices of NEAR, provide an updated view of contracts deployed over time on NEAR. What factors do you think might influence the number of contracts deployed? How might NEAR boost the number of developers and deployments within its ecosystem?
1. Introduction
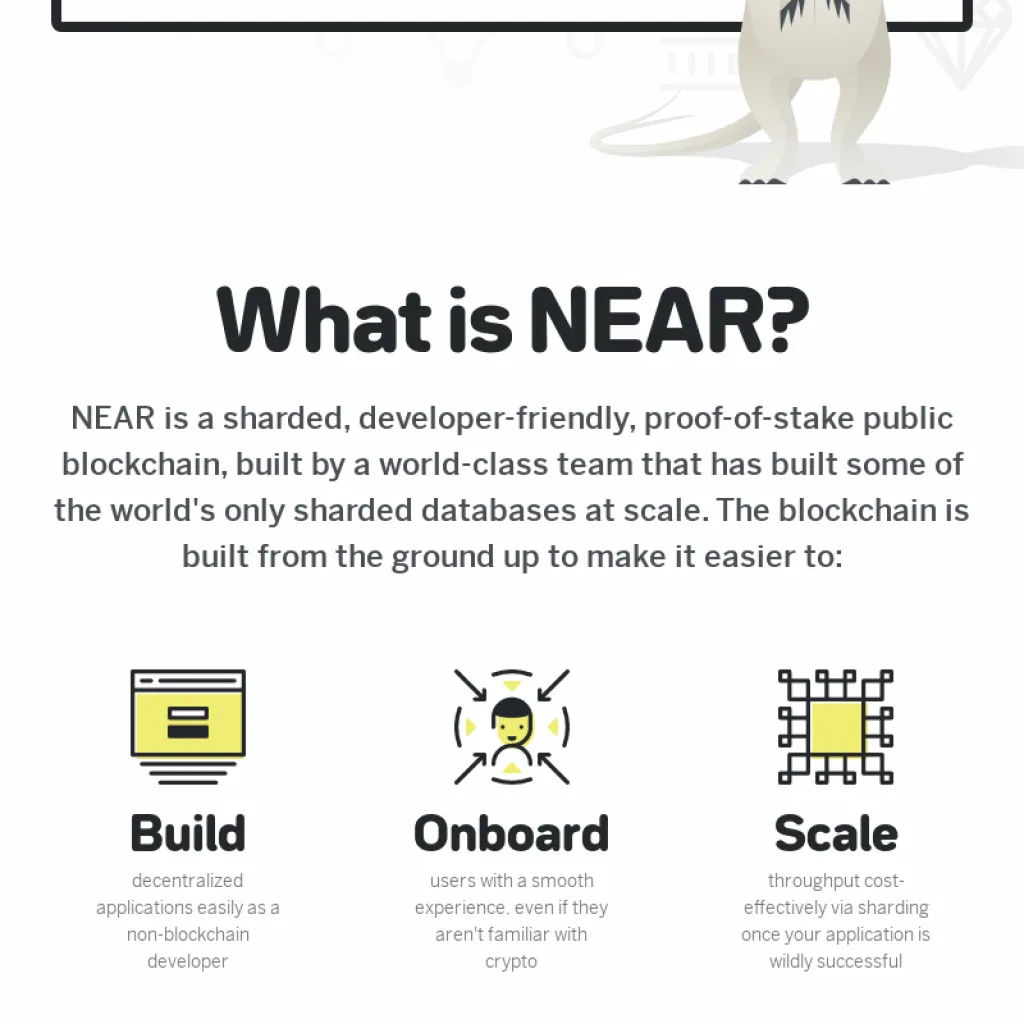
1.1. Near Protocol
Near Protocol is a layer 1 blockchain network. It provides a platform on which developers can build decentralized applications (dapps). The most successful layer 1 blockchain is Ethereum, so protocols like Near are seen as challengers. The key yardsticks for layer 1 networks are transaction costs, speed, and the ability to maintain those features as transaction volumes grow. These factors are the focus for layer 1s like Near to improve upon Ethereum, which has encountered issues with costs and speed over the last few years [].
1.2. Advantages of Near
Near Protocol is faster and cheaper than Ethereum. More importantly, it promises to be faster than some of the other largest challengers. When fully implemented, Near is expected to be able to process up to around 100,000 transactions per second (TPS). Ethereum’s largest rival, Solana, averages less than 3,000 transactions per second, according to its own blockchain explorer. Ethereum averages double-digit transactions per second. Bitcoin does less than 10. Outside the crypto sphere, an important comparison is Visa’s (V) capacity. The global payments giant processes around 7,000-8,000 TPS, based on its claim of 232.5 billion transactions over a 12-month period. Near Protocol could eclipse that, though it has not yet realized its theoretical potential as of July 2022. “Near has built technology to enable transactions that are fast (~1 second), quick to finality (~1-2 seconds), cheap (less than a penny), and secure,” crypto research firm Messari noted in March 2022 [].
\n

2. Methodology
2.1. Aim of This Report
-
In this analysis, we are going to review contracts and smart contracts deployed on NEAR during the past year (Sep 2021 to Sep 2022). It is worth mentioning that a smart contract is a program that contains a collection of code (its functions) and data (its state) that resides at a specific address on the NEAR blockchain
More informationabout smart contracts can be found in this dashboard: []. -
Moreover, a review on NEAR price as well as Burrow (one of the most popular DeFi products built on Near) and Paras (one of the most popular NFT marketplaces in Near) will be carried out.
More informationabout different aspects of the NEAR can be found in this dashboard: []. -
Finally, we will look into Gokustats to compare our findings with the data and results thereof. [
Gokustats] []
2.2. Data Base
The following tables from the flipside-crypto-database have been employed in order to find data and conduct the analysis:
near.core.fact_actions_events
near.core.fact_transactions
near.core.fact_actions_events_function_call
[Ref] [] []
[]
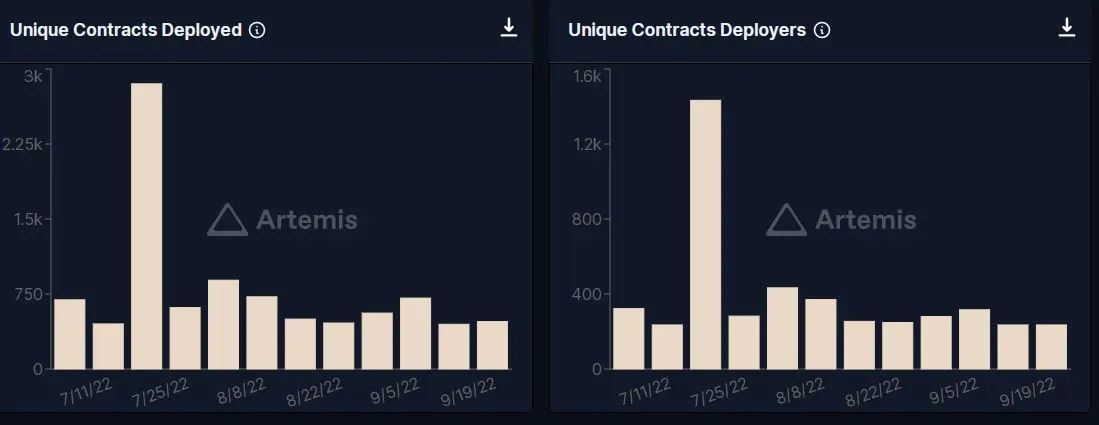
These figures show the following results:
-
In 2021, the most number of contracts has been deployed on Dec (4791).
-
In 2022, the most number of contracts has been deployed on Jul (4838).
-
The total number of deployed contracts on NEAR ecosystem has been increased from about 11K in 2021 to about 31K in 2022.
-
As far as the past three months are concerned the total number of deployed contracts has been decreased as follows:
Jul: 4838
Aug: 2769
Sep: 2167
-
This decreasing trend may indicate the inability of the ecosystem in development,.
In this chart the variation of number of deployed contracts on NEAR protocol since Sep 2021 can be observed.
- Total number of deployed contracts is 42.2K.
- From Sep 2021 to Dec 2021,the most number of contracts has been deployed on 16th Sep (652), 25th Nov (893) as well as 1th (897), 10th (889), 13th (875), and 28th (928) Dec.
- From the first of this ongoing year (2022), the most number of contracts has been deployed on 14th Jan (1003), 8th Feb (1098), 30th Mar (1141) and 7th Jun (1323) as well as 19th (1279) and 21th Jul (1306),
-
As far as the past three months are concerned the total number of deployed smart contracts has decreased as follows:
Jul: 376
Aug: 567
Sep: 395
-
It can bee seen that after Jul, the number of smart contracts has increased to 567, but then again the number of new smart contracts decreased to 395.
-
In 2022, The most number of new smart contracts has been deployed on January (1598, about 24%).
These charts show very useful information about new smart contracts on NEAR ecosystem as follows:
- Total number of smart contracts from Sep 2021 to Sep 2022 is about 10K.
- Total number of smart contracts has increased from about 3.3K in 2021 to about 6.7K in 2022.
- However, these charts show a decreasing trend for the new smart contracts leading to Sep 2022.
- This decreasing trend may also be another sign to indicate the inability of the ecosystem in development.
-
Here we can see the top 10 most interacted with smart contracts.
-
About 82% of all interactions is related to Aurora and NearCrowd.
-
The most interacted with the contract Aurora with about 64M interactions (about 45%).
-
The second most popular contract is NearCrowd, with about 53.5M interactions (about 37%)
-
The third most popular contract is V2.ref-finance.near, with about 6.5M interactions (about 4.5%)
-
Maximum daily usage of top 10 contracts has been recorded on 20th Aug (1.9M) for v2.ref-finance.near.
\n
-
About 4.2k new users on Burrowe are interacting with the platform (deposit, borrow), since Mar 2022.
-
Although the maximum number of new users is recorded on the Apr, this trend is decreasing after this date.
-
At this time, only about 5 to 10 new users enter Burrow daily.
-
The below pi-chart shows the total amount of liquidity (USD) of Burrow that indicates LINEAR and stNEAR constitute bout 50% of the liquidity value for borrowing.
\
-
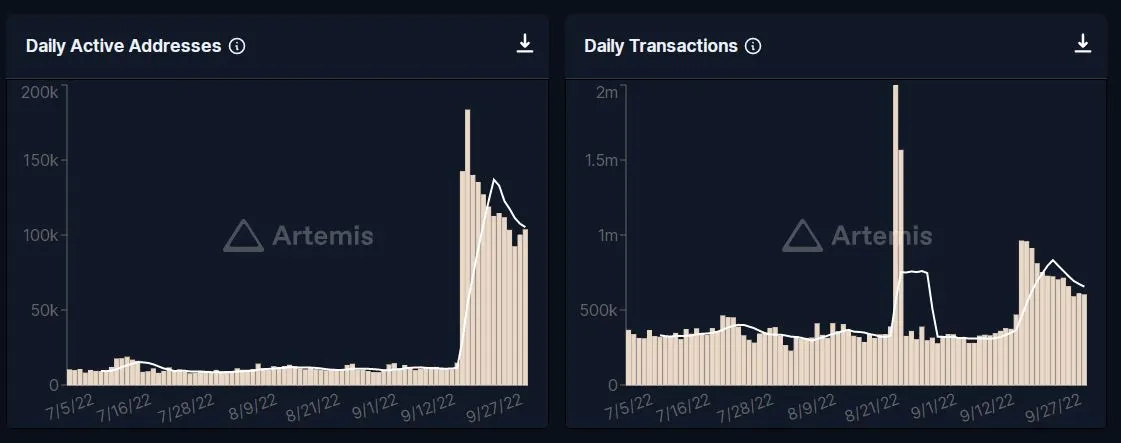
This charts show top 10 users of the NEAR ecosystem.
-
The most usage of a user (5258, about 39.5%) as well as the maximum daily usage (on 15th Jan 2022 with 7209 usage) recorded for:
“7747991786f445efb658b69857eadc7a57b6b475beec26ed14da8bc35bb2b5b6”
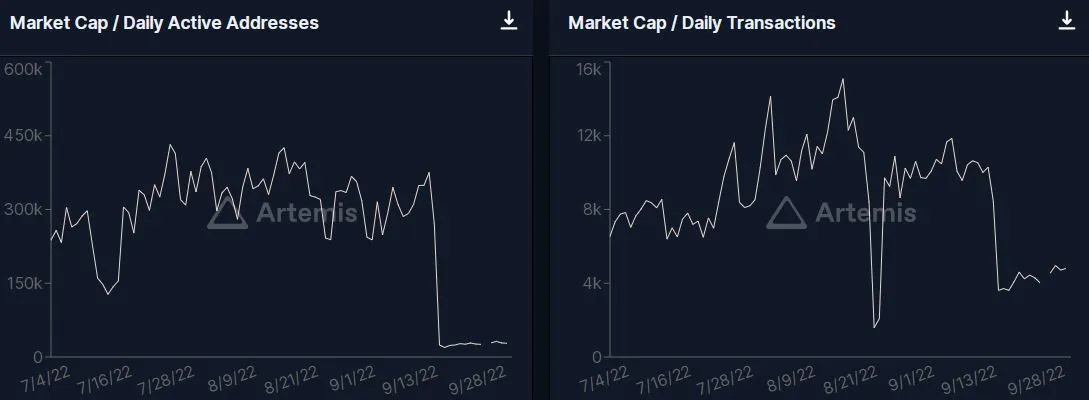
- In this chart the variation of NEAR price has been compared to BTC price.
- As it can be observed they are showing a rather similar trend.
- In fact, the peaks in the NEAR price trend are following money markets and NFT Sales.
This figure shows the number of smart contracts which deployed by wallets.
It can be seen that most of the users have deployed 4, 5, 6 and 9 contracts. The top 3 users have deployed 23, 20, and 18 contracts, respectively.
Summary
-
The total number of deployed contracts has decreased through the past three months leading to Sep 2022 (Jul: 4838, Aug: 2769, and Sep: 2167)
-
A decreasing trend for the new smart contracts leading to Sep 2022 has been observed.
-
About 82% of all interactions with smart contracts are related to Aurora and NearCrowd (the most interacted with the contract Aurora with about 64M interactions, about 45%).
-
The NEAR price’s trend is following money markets and NFT Sales.
-
The number of new users on Burrow is decreasing after Apr 2022.
It is worth mentioning that the results of this dashboard are rather compatible with the results of the NEAR dashboard in Gokustats []. Some similar trends are present in the next section**.**
Acknowledgment:
I would like to thank the authors of the following dashboards that really helped me to do my pwn analysis:
\