RaceDay NFTs [Flow]
How do Speedway Motorsports RaceDay NFTs stack up to sports NFT collections in the FLOW ecosystem? What other projects are RaceDay fans buying? Create a dashboard that shows off a high-level project overview of RaceDAY.
These charts show the daily, weekly, and monthly variation of the sales volume in USDC.
- As can be seen, daily and weekly variation of the sales volume in USDC shows a rather increasing trend.
- The most daily sales volume is recorded on 20 Apr 2022.
- The most weekly sales volume is recorded on the week opened on 18 Apr 2022.
- As far as the monthly variation of the sales volume in USDC is concerned, the Top 3 months are as follows:
- May (about 30K, 39.6%)
- Oct (about 27K, 36.2%)
- Jun (about 6K, 8.44%)
These charts show the daily, weekly, and monthly variation of the sales volume in FLOW.
- As can be seen, daily and weekly variation of the sales volume in USDC shows a rather increasing trend.
- The most daily sales volume in FLOW is recorded on 20 Apr 2022.
- The most weekly sales volume in FLOW is recorded on the week opened on 18 Apr 2022.
- As far as the monthly variation of the sales volume in USDC is concerned, the Top 3 months are as follows:
- Oct (about 16K, 51.7%)
- May (about 6.4K, 20.7%)
- Jun (about 3.6K, 11.5%)
These charts show the daily, weekly, and monthly variation of the number of sales.
- As can be seen, daily and weekly variation in the number of sales shows a fluctuating and rather decreasing trend leading to the recent months.
- As far as the monthly variation of the number of sales is concerned, the Top 3 months are as follows:
- Aug (27,19.3%)
- May (23, 16.4%)
- Jun (20, 14.3%)
These charts show the daily, weekly, and monthly variation of the number of sellers.
- As can be seen, daily and weekly variation in the number of sellers shows a fluctuating and rather decreasing trend leading to the recent months.
- As far as the monthly variation of the number of sellers is concerned, the Top 3 months are as follows:
- May (15, 16.5%)
- Aug (13, 14.3%)
- Nov (13, 14.3%)
These charts show the daily, weekly, and monthly variation of the number of buyers.
- As can be seen, daily and weekly variation in the number of buyers shows a fluctuating and rather decreasing trend leading to the recent months.
- As far as the monthly variation of the number of buyers is concerned, the Top 3 months are as follows:
- Oct (14, 24.1%)
- May (9, 15.5%)
- Jun (7, 12.1%)
This chart shows the cumulative sales volume in USD and FLOW.
- Total Sales Volume in USD: about 85K
- Total Sales Volume in FLOW: about 26K
\n
Acknowledgment and supplementary Information
- I would like to show my sincere gratitude to the authors of the following dashboards that helped me very much indeed to do my own analysis: * *
- Author: NSA2000
- Twitter of the Author: @NSA2000C
- Discord of the Author: NSA2000#5651
- Data from FlipsideCrypto
- Twitter of RaceDayNFT: @RaceDayNFT
- Website of the RaceDayNFT: racedaynft.com
- Link of this dashboard’s tweet:
This chart shows the daily variation of the new users. As can be seen, the number of new users is rather constant with some exceptions on 15 Oct 2021, 17 Oct 2021, and 25 May 2022.
These pie charts show the number of cross-project sales, users, and sales volume in USD according to different collections since Oct 2021.
- As far as the number of cross-project sales is concerned, the top 3 collections are
RaceDay_NFT (4.4K, 17.2%), TopShot (4K, 15.8%), and AllDay (3.6K, 14.2%). - As far as the number of cross-project sale users is concerned, the top 3 collections are
RaceDay_NFT (973, 27%), TopShot (410, 11.4%), and AllDay (384, 10.7%). - As far as the number of cross-project sale volume in USD is concerned, the top 3 collections are
StarlyCard (2.7M, 26.2%), AllDay (2.28M, 21.8%), and UFC_NFT (834K, 7.8%).
These pie charts show the number of secondary sales and users thereof compared to mint sales and users:
- As far as the number of sales is concerned, mint sales has the upper hand (131K, 97%) compared to secondary sales (4.4K, 3%).
- As far as the number of users is concerned, the share of mint sale users and secondary sale users is about fifty-fifty.
This chart shows the average buyers per day.
- It can be observed that, the average buyers per day showing a decreasing trend from 15 Oct 2021 to 4 May 2022.
- After May, 2022 the the average buyers per day trend is rather constant.
- Total unique buyer: 516
These bar charts represents the number of cross-project sales, buyers and sales volume in USD.
- As far as the number of cross-project sales is concerned, other collections (23K)have the upper hand compared to the RaceDay collection (4.4K).
- As far as the number of cross-project buyers is concerned, RaceDay collection (516) has the upper hand compared to the other collections (265).
- As far as the number of cross-project sales volume in USD is concerned, other collections (13.6M) have the upper hand compared to the RaceDay collection (85K).
This chart shows the daily variation of the average sale price and 7-day moving average. It can be seen that both parameters are showing significantly increasing trends.
Summary
-
In this analysis, a comprehensive review on the
RaceDay NFTshas been carried out. -
The daily and weekly variation of the sales volume in USDC shows a rather increasing trend.
-
The most daily sales volume is recorded on 20 Apr 2022.
-
The most weekly sales volume is recorded on the week opened on 18 Apr 2022.
-
As far as the monthly variation of the sales volume in USDC is concerned, the Top 3 months are as follows:
- May (about 30K, 39.6%)
- Oct (about 27K, 36.2%)
- Jun (about 6K, 8.44%)
-
The daily and weekly variation of the sales volume in USDC shows a rather increasing trend.
-
The most daily sales volume in FLOW is recorded on 20 Apr 2022.
-
The most weekly sales volume in FLOW is recorded on the week opened on 18 Apr 2022.
-
As far as the monthly variation of the sales volume in USDC is concerned, the Top 3 months are as follows:
- Oct (about 16K, 51.7%)
- May (about 6.4K, 20.7%)
- Jun (about 3.6K, 11.5%)
-
Total Sales Volume in USD: about 85K
-
Total Sales Volume in FLOW: about 26K
-
The daily and weekly variation in the number of sales shows a fluctuating and rather decreasing trend leading to the recent months.
-
As far as the monthly variation of the number of sales is concerned, the Top 3 months are as follows:
- Aug (27,19.3%)
- May (23, 16.4%)
- Jun (20, 14.3%)
-
The daily and weekly variation in the number of sellers shows a fluctuating and rather decreasing trend leading to the recent months.
-
As far as the monthly variation of the number of sellers is concerned, the Top 3 months are as follows:
- May (15, 16.5%)
- Aug (13, 14.3%)
- Nov (13, 14.3%)
-
The daily and weekly variation in the number of buyers shows a fluctuating and rather decreasing trend leading to the recent months.
-
As far as the monthly variation of the number of buyers is concerned, the Top 3 months are as follows:
- Oct (14, 24.1%)
- May (9, 15.5%)
- Jun (7, 12.1%)
-
The average number of buyers per day showed a decreasing trend from 15 Oct 2021 to 4 May 2022.
-
After May 2022 the average buyers per day trend is rather constant.
-
Total unique buyers: 516
-
As far as the number of sales is concerned, mint sales has the upper hand (131K, 97%) compared to secondary sales (4.4K, 3%).
-
As far as the number of users is concerned, the share of mint sale users and secondary sale users is about fifty-fifty.
-
The daily variation of the average sale price and 7-day moving average showed significantly increasing trends.
-
As far as the number of cross-project sales is concerned, other collections (23K)have the upper hand compared to the RaceDay collection (4.4K).
-
As far as the number of cross-project buyers is concerned, RaceDay collection (516) has the upper hand compared to the other collections (265).
-
As far as the number of cross-project sales volume in USD is concerned, other collections (13.6M) have the upper hand compared to the RaceDay collection (85K).
-
As far as the number of cross-project sales is concerned, the top 3 collections are
RaceDay_NFT (4.4K, 17.2%), TopShot (4K, 15.8%), and AllDay (3.6K, 14.2%). -
As far as the number of cross-project sale users is concerned, the top 3 collections are
RaceDay_NFT (973, 27%), TopShot (410, 11.4%), and AllDay (384, 10.7%). -
As far as the number of cross-project sale volume in USD is concerned, the top 3 collections are
StarlyCard (2.7M, 26.2%), AllDay (2.28M, 21.8%), and UFC_NFT (834K, 7.8%). -
The average number and the average purchase price of the NFTs held per wallet have been calculated to be about 5.27 and 130.14, respectively.
-
The number of new users is rather constant with some exceptions on 15 Oct 2021, 17 Oct 2021, and 25 May 2022.
-
The weekly variation of cross-project users NFTs interactive shows a significantly decreasing trend since Oct 2021.
-
The total number of NFT buyers is 286.
-
The total number of NFT interactors is 122.
-
The total number of New users is 472K.
-
The total number of New users with more than 1-day activity is 375K.
These charts show the weekly and cumulative variation of cross-project users NFTs interactive.
- The weekly variation of cross-project users NFTs interactive shows a significantly decreasing trend since Oct 2021.
- The total number of NFT buyers is 286.
- The total number of NFT interactors is 122.
- The total number of New users is 472K.
- The total number of New users with more than 1-day activity is 375K.
1. Introduction
An NFT is a one-of-a-kind piece of digital content (such as an image or a video) that is an officially licensed collectible. The NFTs ownership is authenticated and verifiable by the blockchain, a technology used for things like bitcoins. That means copies of videos, images, and even animated gifts can multiply on the internet, but there can be only one with a certificate of authenticity. Like other collectibles, you can buy, sell, and trade them.
Flow is a fast, decentralized, and developer-friendly blockchain built by Dapper Labs to power some of the biggest brands’ NFTs and digital collectibles such as the NBA, UFC, CNN, Warner Music Group, Dr. Seuss, Ubisoft, and more. Flow leverages an environmentally friendly design via Proof-of-Stake that consumes thousands of times less energy than Proof-of-Work blockchains like the current Ethereum network. The eco-friendly structure, scalability, and diversity of projects building on Flow are key reasons we chose to run Canes Vault on the Flow blockchain.
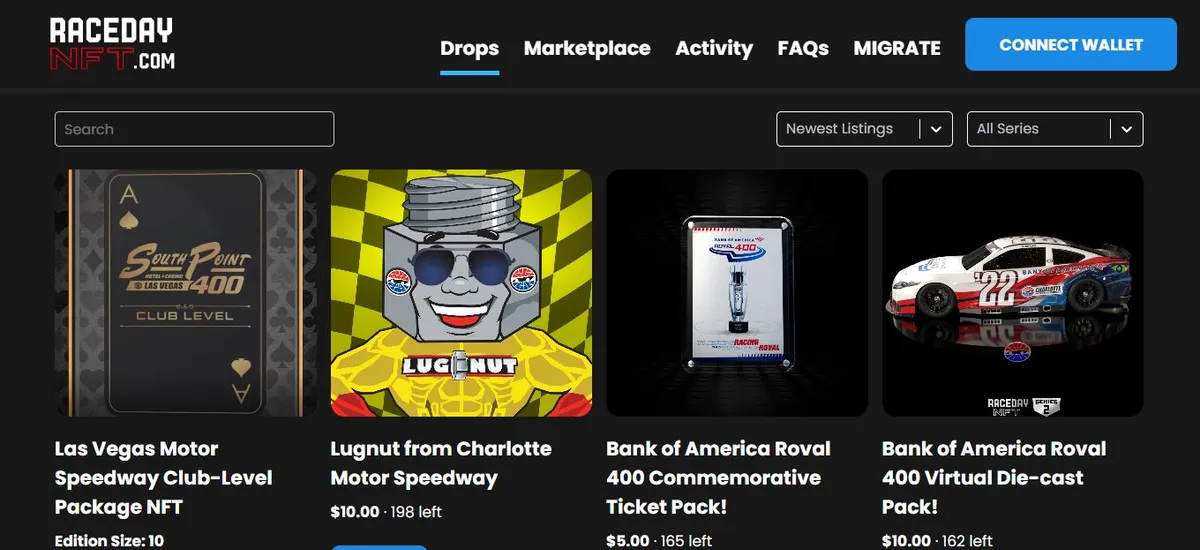
RaceDay NFT a first-of-its-kind motorsports NFT marketplace for race fans. The digital collections featured on RaceDayNFT will showcase unique racing collectibles from several well known Motorsports brands.
What is an NFT? []
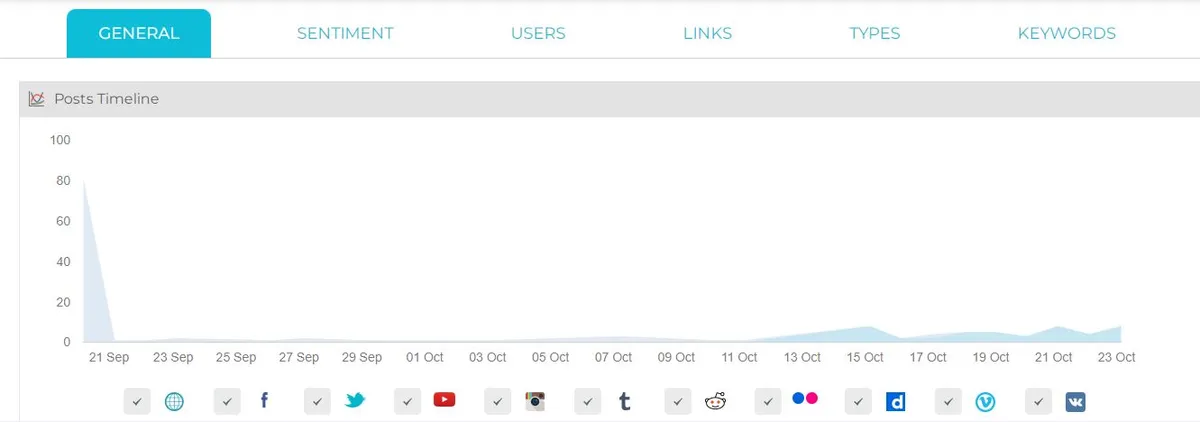
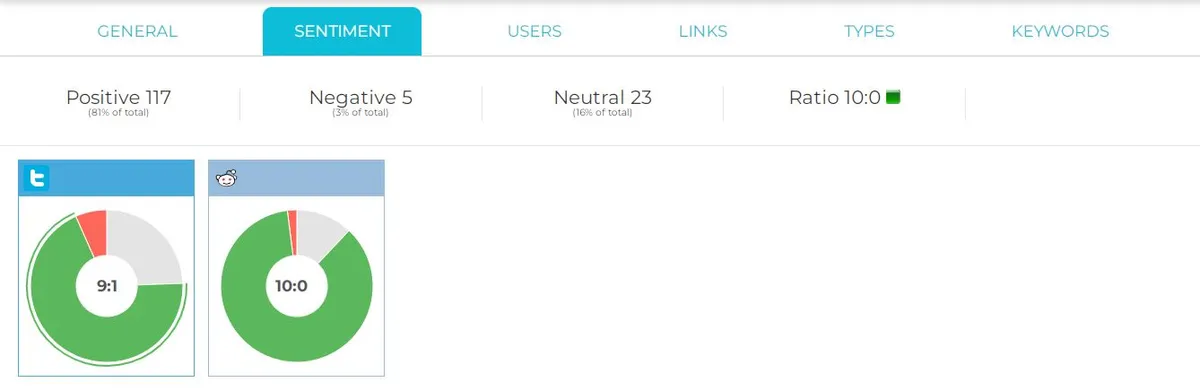
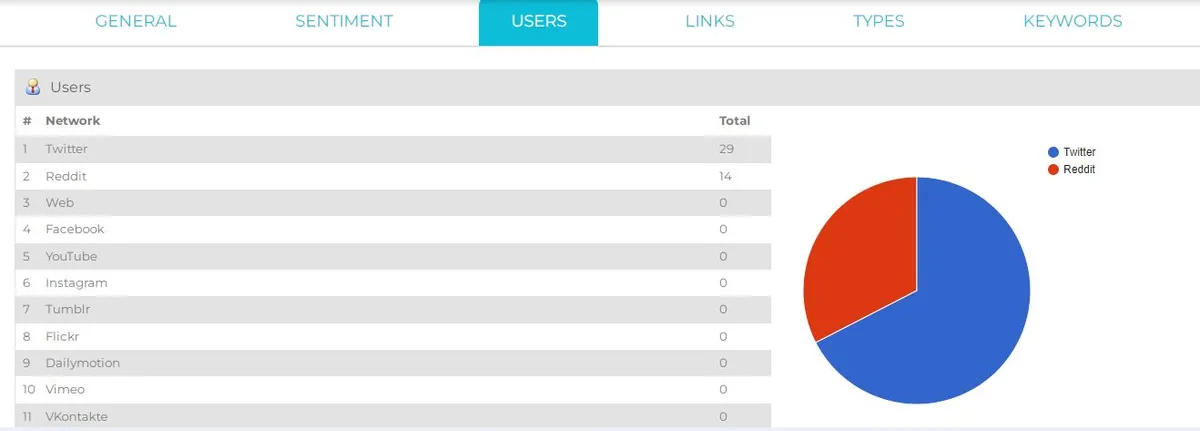
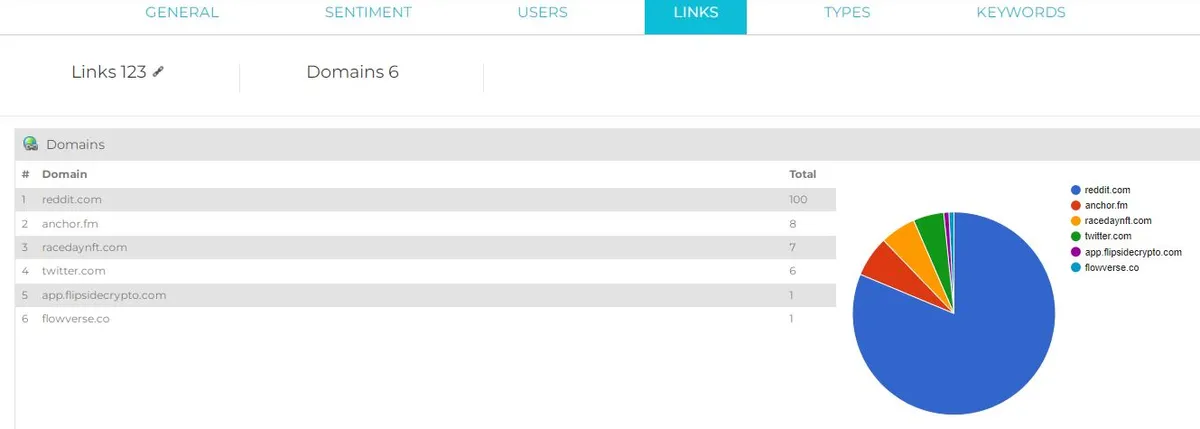
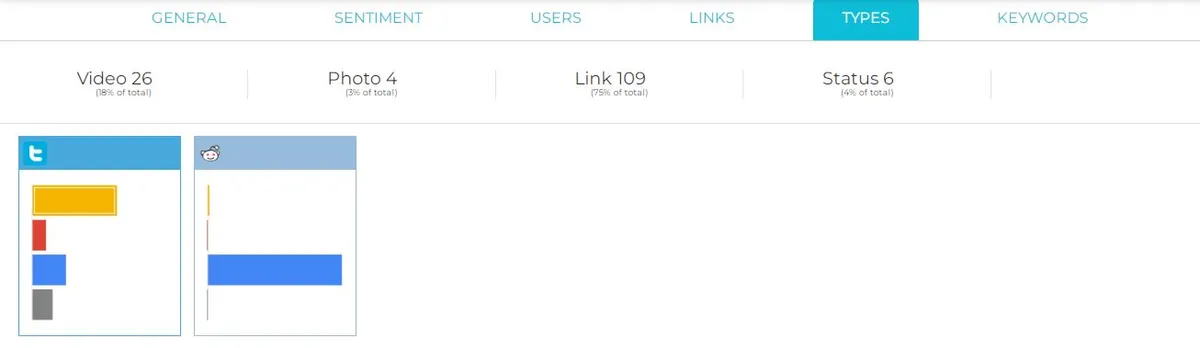
The following statistics, shows the social mentions and shares of the RaceDay_NFT, these data, charts, and pictures are obtained from: .
\n
[]
2. Methodology
The data in this review is obtained from the following tables:
flow.core.fact_pricesflow.core.ez_nft_salesethereum.core.dim_datesflow.core.fact_eventsflow.core.fact_transactions
Aim of this analysis:
In this analysis, a comprehensive review on the RaceDay NFTs has been carried out in terms of:
- Average Sales Volume (daily/weekly/monthly)
- Total Sales Volume
- Secondary Sales vs. Mint Sales
- Daily Average Sales Price and 7-day moving average
- Total Unique Buyers
- Average Buyers/Day
- Social Mentions/Shares
- Other collections RaceDay fans are buying
- Purchase frequency, or the distribution of tokens owned per wallet
- Average Number of NFTs held per wallet
- Average Purchase Price of NFTs held by RaceDay fans
- Free redemption buyers to future buyers (first-time purchasers someone that claimed a free NFT previously, or, was their first experience with RaceDay an actual purchase)
In this table, average number and average purchase price of the NFTs held per wallet have been calculated to be about 5.27 and 130.14, respectively. \n