Ethereum NFT - Zombie Collection and Wash Trading
Exploring Zombie Collections and Sales Volume on Ethereum
:art: Sales Count
Number of NFTs sold. Wash volume charts are not included as they constitute the minority of the sales count (i.e. washes are high-value but low-frequency transactions). As shown in this earlier analysis.
- Even after accounting for wash trades, the 2021 NFT collections still contributed to over 49.5% of the all-time NFT sales volume on Ethereum.
- Older collections from 2017 and 2020 specifically still contributed to a sizeable amount of sales volume.
- The charts above show the NFT sales volume by the NFT collection year. This way, we can see which collection contributed to the majority of the sales volume (older or newer ones)
- At present, NFT collections from 2018-2019 contributed to <0.1% of sales volume - for some reason, collections from this year don’t sell/stick around particularly well when it comes to sales volume
- Once wash trading is accounted for, we see the 2021 collections volume dropping by 10-20% in dominance (in the area chart). It will be interesting to see how much % dominance will the blue chips from 2021 hold up into 2023
The chart above shows the # of collections created by the collection year as well as the # of zombie collections, defined as those which have not moved or sold in the last 30 days
- We can see exponential growth in NFT collections in 2022
- More NFTs were classified as zombie collections when we count by sales event (over movement event).
- There were 117k+ unique collections (by contract address) at the time of analysis in October 2022, compared to the 21k created in the entire 2021
When we compare the % of collections that have not moved in the last 30 days by the collection year (from the first mint/transfer of each collection), we can see that newer collections are more active in terms of transfers.
- For the 2022 collections alone itself, 90% of the collections created in 2022 were no longer sold in the last 30 days
- For some reason, the 2021 collections were slightly more active in sales compared to the 2022 collections (by around 2%)
- Older collections (from 2017 onwards) have barely any sales/movement
One clear difference we see is that newer NFT collections (2022) already surpass 2021 collections in terms of sale count - from this, we can infer that 2021 collections that stick around are likely high-volume/value collections. Across all the years, we see a gentle decline in sales count from the older collection as we move into the new year.
Zombie Collections
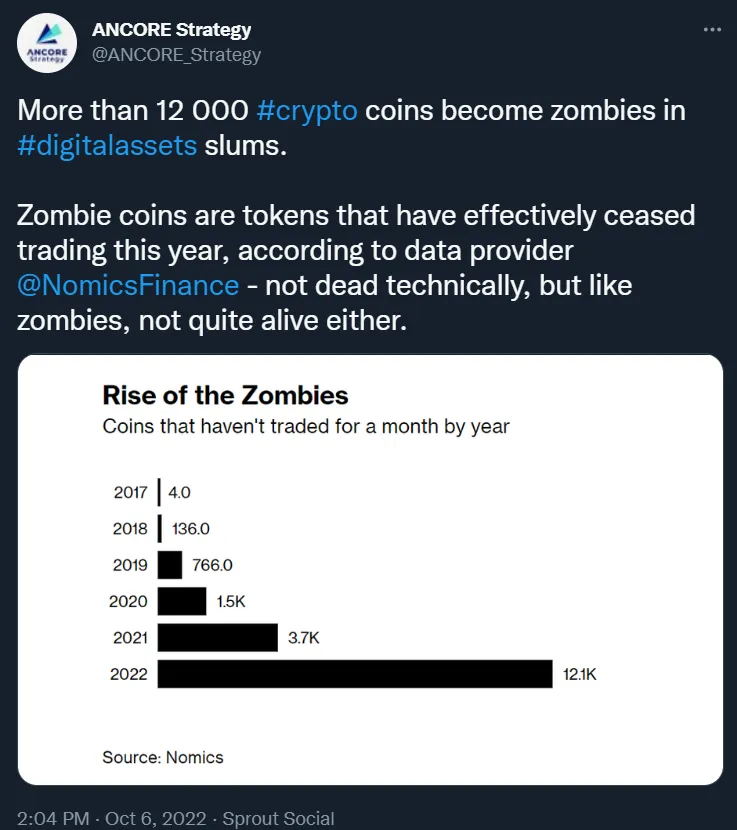
Nomics Finance (figure) recently presented an analysis of zombie coins - coins that haven’t traded for a month by year. It shows that over 12k crypto coins were classified into this category.
Zombie NFT collections
Much like coins, multiple NFT collections have suffered the same fate (coupled with rugs + free mints). Each collection has a unique contract address generated at deployment, allowing us to track its movement and sales - with on-chain data, we can find zombie collections and dive a bit deeper into the current sales volume of NFT on Ethereum to find whether it is driven by new or old collection?


The charts above show the number of unique collections, sales volume, and sales count over time for Ethereum NFT, grouped by the status of the collection (sold last 30 days).
We can see from the unique collections chart that the % of zombie collections increases as well go back in time - this tells us that older collections sold that previously at that time point is no longer active in the last 30 days. More recent collections were more active (understandably). Interestingly, zombie collections contribute to a fraction of the sales volume and sales count over time at the moment.